
The chart bellow shows the percentage of people who ate five portions of fruit and vegetables per day in the UK from 2001 to 2008.The chart bellow shows the percentage of people who ate five portions of fruit and vegetables per day in the UK from...
Hello, everyone. Can you review my paper and give some feedback for it be better?
The given bar chart is a diagrammatic illustration of the proportion of men, women and children consuming five servings of fruit and vegetables during a week in the period from 2001 and 2008 in UK.
Overall, one notable feature seem to be that the highest percentage of all people eating fruit and vegetables was women whereas children accounted for at least at all periods.
With regards to the amount of women consumed, it began at around 21% (2001) and gained substantially to over 30% (2006). Then, it had a marginal change which was about 27% in the final years.
In term of men and children eating fruit and vegetables, the rate moved steadily in the first three years (about 17% and 12% respectively). From this point, the proportion of men had a significant change and reached a pick of about 27% in 2006 while children climbed to a new pick after a year ( 25%). In the last two years, both had decreased sharply about 2%-3%.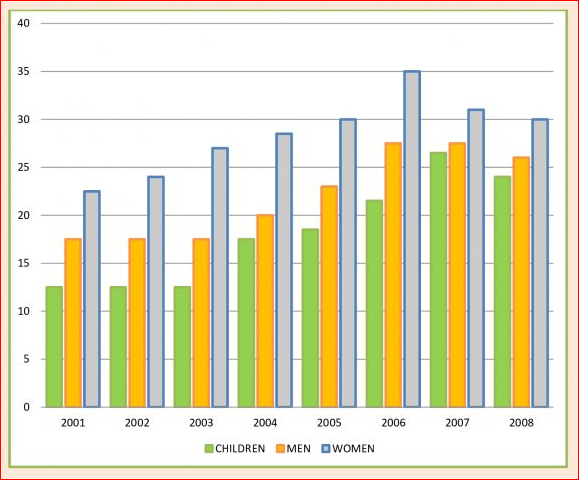
Top answer
Please do not put the essay instructions in the "Subject" line. Put it with your answer in the message body. The chart bellow shows the percentage of people who ate five portions of fruit and vegetables per day in the UK from...
- Please do not put the essay instructions in the "Subject" line.
- Put it with your answer in the message body.
- The chart bellow shows the percentage of people who ate five portions of fruit and vegetables per day in the UK from...
- Please copy the instructions completely and correctly.
- ) ---------------------
Get the Weekly English Kit 📬
New words, one handy idiom, and a 2-minute quiz — delivered to your inbox to keep your streak alive.
Please do not put the essay instructions in the "Subject" line.
Put it with your answer in the message body.
Subject: Please review my IELTS essay
Message body:
Topic:
The chart bellow shows the percentage of people who ate five portions of fruit and vegetables per day in the UK from 2001 to 2008.The chart The given bar chart is a diagrammatic illustration (That is not a good expression.) of the proportion of men, women and children consuming five servings of fruit and vegetables during a week (incorrect) in the period from 2001 and 2008
 Related Questions