
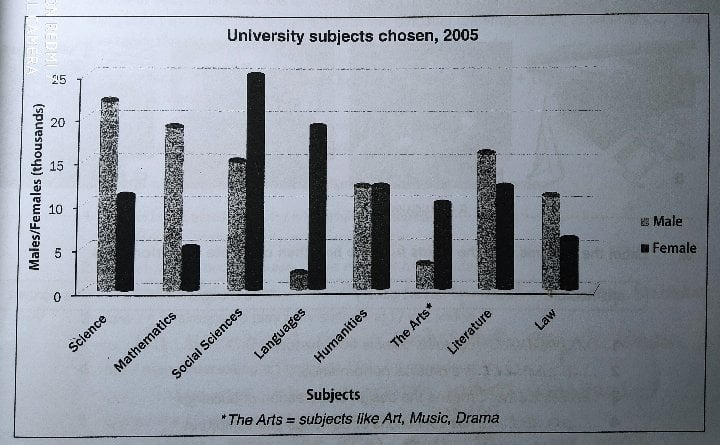
The bar chart below shows the number of students who chose certain university subjects in 2005. Summarise the information by selecting and reporting the main features, and make comparisons where relevant.
The chart compares student numbers who had a certain university subjects' choices in 2005. Overall, most of female non-verbal subjects like Socia Sciences and Language. Whereas, most of male chose Technical subjects suchs as Mathematics and Science.
As can be seen from the chart, Social Science was the subject that was chosen most by female (at about 25 thousands) and Language was the second one (at nearly 20 thousands). Meanwhile, subjects like Mathematics and Law wasn't chosen as many as other subjects by women, making up just 5 thousand people. Science was the most popular subjects with men, over 20 thousand men chose it. Besides, Mathematics was qute popular with nearly 20 thousand men. Nevertheless, Languages and the Arts was the least popular with male: just 2 and 3 thousands. The number of men and women who chose Humanities was the same.
Top answer
Please do not put the essay instructions in the "Subject" line. Put it with your answer in the message body. Subject: Please review my IELTS essay Message body: Topic: The bar chart below shows the number of students who chose certain university subjects in 2005.
- Please do not put the essay instructions in the "Subject" line.
- Put it with your answer in the message body.
- Subject: Please review my IELTS essay Message body: Topic: The bar chart below shows the number of students who chose certain university subjects in 2005.
- Summarise the information by selecting and reporting the main features, and make comparisons where relevant.
- ) ---------------------
Get the Weekly English Kit 📬
New words, one handy idiom, and a 2-minute quiz — delivered to your inbox to keep your streak alive.
Please do not put the essay instructions in the "Subject" line.
Put it with your answer in the message body.
Subject: Please review my IELTS essay
Message body:
Topic:
The bar chart below shows the number of students who chose certain university subjects in 2005. Summarise the information by selecting and reporting the main features, and
You wrote less than the minimum word count, so you will lose points for that. You need three paragraphs; two is insufficient. Also, there are many errors in selecting singular versus plural forms.
The chart (What kind of chart? A pie chart? Organization chart? ) compares student numbers
 Related Questions