
Task1 - could you please give me some comments about this task 1
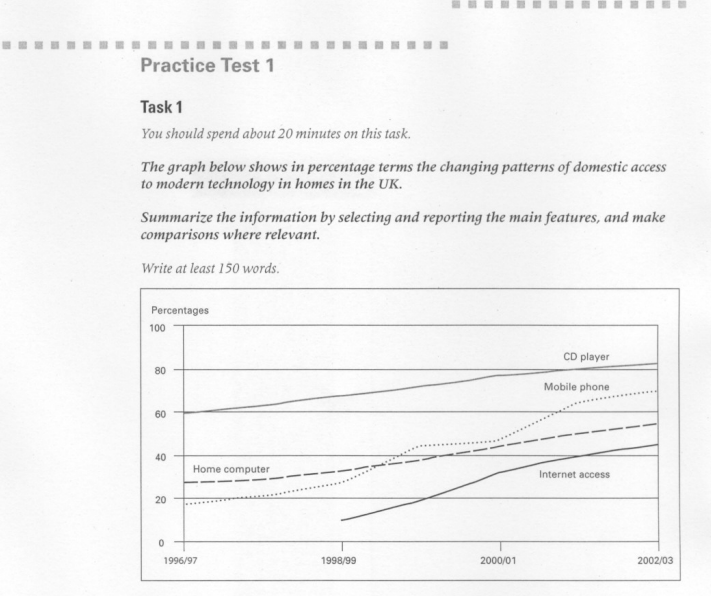
The line graph compares the percentage of changing patterns of domestic access to modern technological devices in families in the UK
Overall, the period could be divided into two parts: before and after 1998. As regards the first, there were 3modern devices used: CD player, home computer and mobile phone. From early 1999, internet was accessed to British homes.
There was nearly 20% in percentage of household using mobile phone in the first period, before gradually increasing to 25% on 1998. Likewise, home computer use and CD use were steady rise from 25% to 30% and from 65% to 65% respectively
During last four year, internet was provided at the first time and then was up over 4 years, rising gradually from 10% to 25% until 2003. Furthermore, there were steady increase in CD player and mobile phone also. In 2003, the percentage of CD use in homes in the UK reached a peak of 82%. Whilst ,the trend for mobile phone was significant fluctuation, then the figure accounted in that stood at 65% at the end of period.
Thank you so much and have a good day!
Top answer
) in the UK (missing punctuation) Overall, the period could be divided into two parts: before and after 1998. ) As regards In the first, there were 3modern devices used: CD player, home computer and mobile phone. From early 1999, internet was accessed (wrong word) to British (wrong word) homes.
- ) in the UK (missing punctuation) Overall, the period could be divided into two parts: before and after 1998.
- ) As regards In the first, there were 3modern devices used: CD player, home computer and mobile phone.
- From early 1999, internet was accessed (wrong word) to British (wrong word) homes.
- There was nearly 20% in percentage (The symbol "%" mean percentage.
- ) of household (wrong form) using mobile phone (wrong form) in the first period, before gradually increasing to 25% on (wrong word) 1998.
Get the Weekly English Kit 📬
New words, one handy idiom, and a 2-minute quiz — delivered to your inbox to keep your streak alive.
The line graph compares the percentage of changing patterns (There are no "percentage of patterns" on this graph.) of domestic access to modern technological devices in families (??) in the UK (missing punctuation)
Overall, the period could be divided into two parts: before and after 1998. (You have not sp
To improve your score, compute the rates of growth of the usage of or access to these technologies. All the lines on this particular graph fit a LINEAR curve quite well, so the average rate of growth can be compared.
Growth rate of CD Player usage: = (82%-59%)/6 years = 3.8% per year
Growth rate of Mobile phone access: = (68%-17%)/6 years = 8.5% per year
Growth rate of Home co
 Related Questions