
Task1, bar graph
Hi,
Could you please check the following report?
You should spend about 20 minutes on this task.
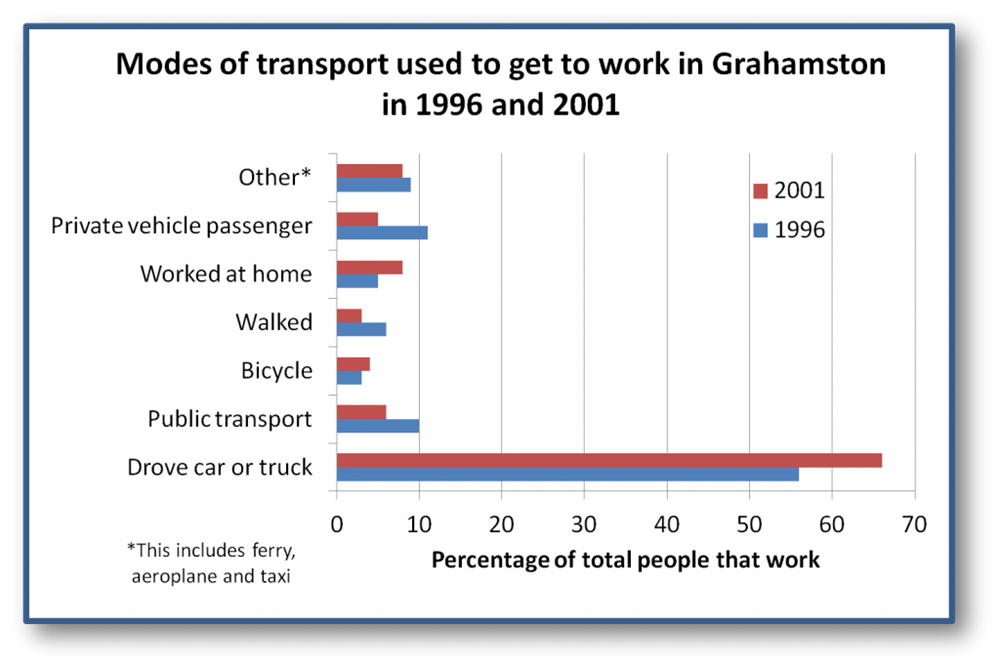
The chart below shows how people travelled to work in 1996 and 2001.
____________________________________________________________
The data is presented in the form of a bar chart regarding how citizens commuted to work in Grahamston. The graph compares different modes of transport in two separate years: 1996 and 2001. Overall, all the modes experienced a change during the period, albeit to varying degrees, and except "car or truck", the other means clustered almost below 10 percent.
As can be seen, it was driving a car or truck that enjoyed the greatest popularity in both years. The figure stood at approximately 55% in 1996 before a rise of around 10 percent in 2001.
In 1996, bicycling had become the least popular mode in the list with almost 3%. By contrast, pedestrians accounted for the smallest group in 2001 with roughly the same percent.
A more detailed look at the chart reveals that the most significant decline occurred in the use of private passenger vehicle with half the percentage in 2001 as in 1996.
Top answer
Persian Learner The data is presented in the form of a bar chart This phrase is used when discussing how the data is presented. Here all we need is to know what it is. The bar chart shows ...
- Persian Learner The data is presented in the form of a bar chart This phrase is used when discussing how the data is presented.
- Here all we need is to know what it is.
- The bar chart shows ...
- Persian Learner citizens Workers are not necessarily citizens: some may be temporary immigrants, or seasonal workers.
- Persian Learner The graph A bar chart is a chart, not a graph.
Get the Weekly English Kit 📬
New words, one handy idiom, and a 2-minute quiz — delivered to your inbox to keep your streak alive.
Persian LearnerThe data is presented in the form of a bar chart
This phrase is used when discussing how the data is presented. Here all we need is to know what it is. The bar chart shows ...
Persian Learnercitizens
Workers are not necessarily citizens: some may be temporary immigr
 Related Questions