
Task1
The graph shows three sectors of global water use and the table illustrates water consumption in two different countries.
The graph shows global water use by agriculture, Industrial use and Domestic use. In 2000 agriculture reach the peak point. It’s about 3000 km. It started from 500 km in 1900 and grow gradually for 50 years. From 1950 onwards it goes up significantly until 2000. Two other sectors increase steadily from 1950 to 2000. Before that water consumption was minimal for them from 1900 to 1950. Industrial use is about 1000 km and Domestic use is 500 km.
The table illustrates the differences in agricultural consumption in some areas of the world by contrasting the amount of irrigated land in Brazil with DRC. 26500 amount of water is used in agricultural in Brazil with a population of 176 million, which means that 359 m per person.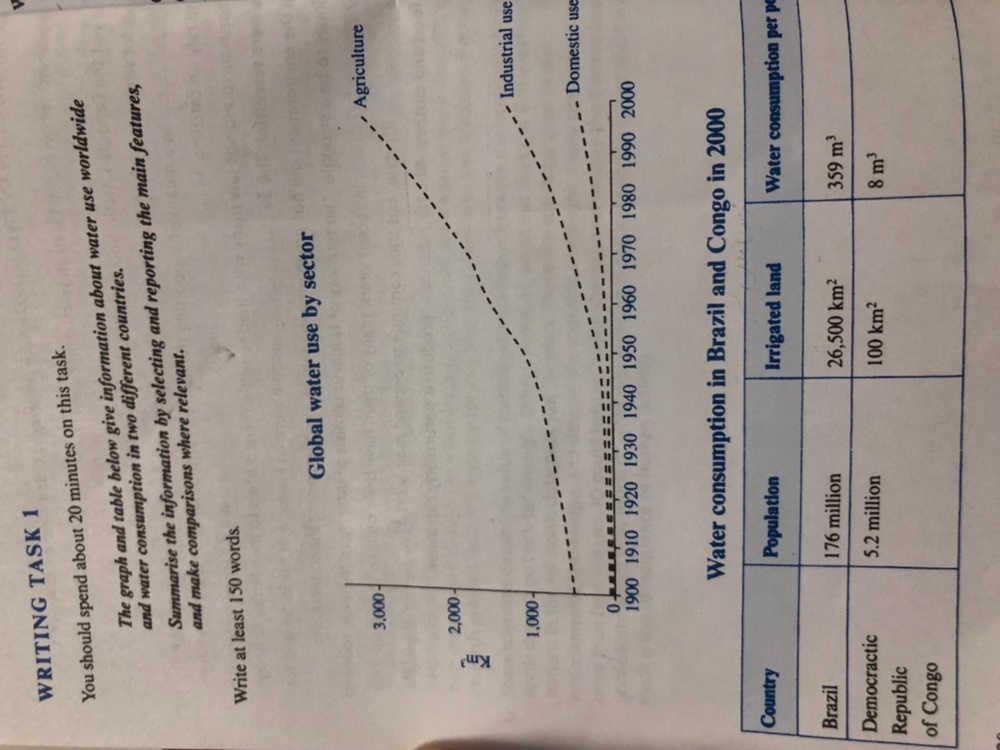
DRC with 5.2 million of population used 100 km in agricultural which means that 8 m per person.
Top answer
Please read my advice for Task 1: IELTS TASK 1: Hints, Tips And Advice The graph shows three sectors of global water use and the table illustrates water consumption in two different countries. (Incomplete and inadequate description. What are the sectors?
- Please read my advice for Task 1: IELTS TASK 1: Hints, Tips And Advice The graph shows three sectors of global water use and the table illustrates water consumption in two different countries.
- (Incomplete and inadequate description.
- What are the sectors?
- What kind of graph is it?
- What is the time range?
Get the Weekly English Kit 📬
New words, one handy idiom, and a 2-minute quiz — delivered to your inbox to keep your streak alive.
Please read my advice for Task 1: IELTS TASK 1: Hints, Tips And Advice
The graph shows three sectors of global water use and the table illustrates water consumption in two different countries. (Incomplete and inadequate de
 Related Questions