
Task 1_Line graph_Edit
Hello,
Kindly check and edit the vocabulary and grammar of my task 1, with many thanks.
Practice: 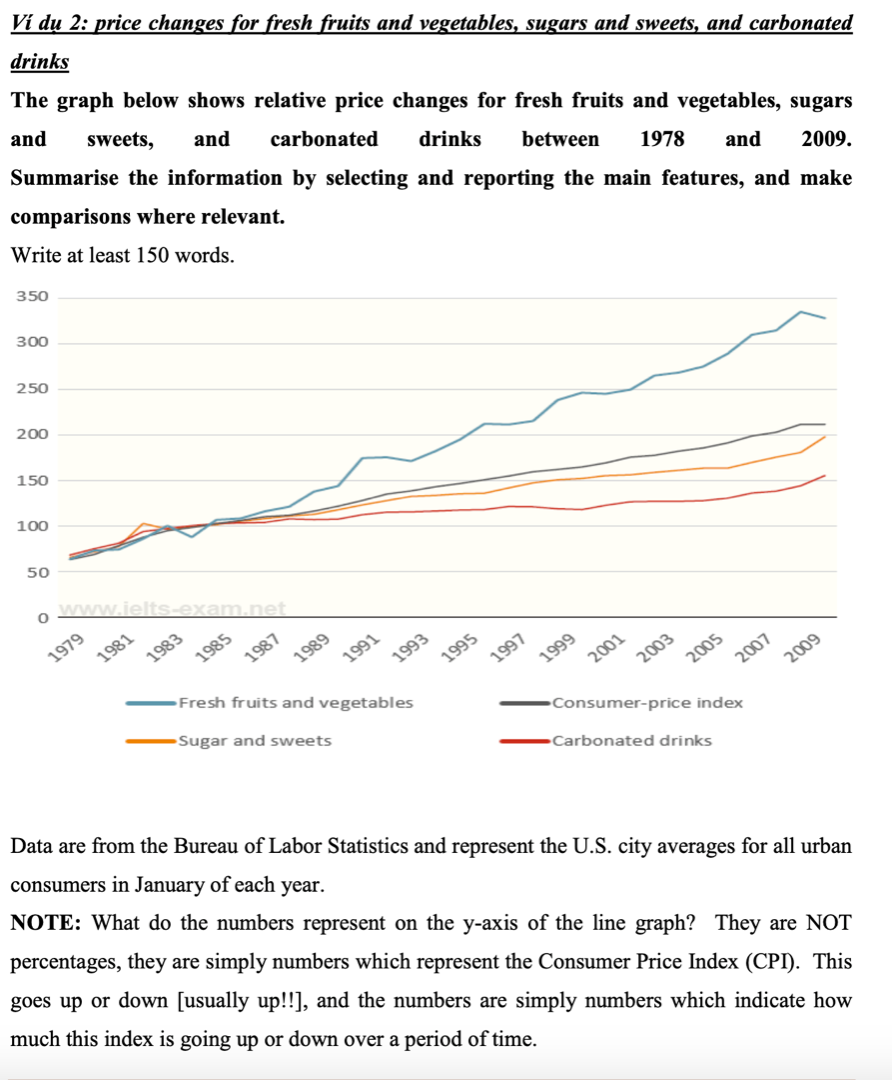
The line graph compares the price changes for 3 different foods with consumer price index from 1979 to 2009.
Overall, all of 3 different foods and consumer price index increased moderately, but price of the fresh fruits and vegetables was higher than consumer price index and rapidly rised in most years.
As is presented in the graphs, all of the lines was approximately 60 in 1979 and slightly increased in the period after. Eventhough, these price were also lower than the general consumer price index. After many minor fluctuations , the number for sugars and sweets reached the highest price with 200 in 2009 and the price of carbonated drinks with 150 in the same time.
Price for fresh fruits and vegetables rose dramatically in whole the time, particularly after the 1989s. From the same time at the start of the period with 60, the number for fresh fruits and vegetables reached a peak with nearly 340 in 2009, growth to 280 in the period of 30 years.
Top answer
The line graph compares the relative price changes for 3 three (Do not use numerals for small numbers that are not data values. ) different categories of foods with consumer price index from 1979 to 2009. (Incomplete.
- The line graph compares the relative price changes for 3 three (Do not use numerals for small numbers that are not data values.
- ) different categories of foods with consumer price index from 1979 to 2009.
- (Incomplete.
- ) Overall, all of 3 different foods the different indices and consumer price index increased moderately, but relative price of the category fresh fruits and vegetables was higher than consumer price index and rapidly rised in most years.
- As is presented in the graphs, (There is one graph, and the reader knows you are describing it.
Get the Weekly English Kit 📬
New words, one handy idiom, and a 2-minute quiz — delivered to your inbox to keep your streak alive.
The line graph compares the relative price changes for 3 three (Do not use numerals for small numbers that are not data values. Use words.) different categories of foods with consumer price index from
 Related Questions