
TASK 1_FUNDING FOR R&D
This is my next writing as a practice. Please read it and give me any advice to improve. Any feedback is highly appreciated. In case there are so many mistakes in this writing, can you kindly give me a sample essay. Thank you very much.
The topic is written in the attached picture
.
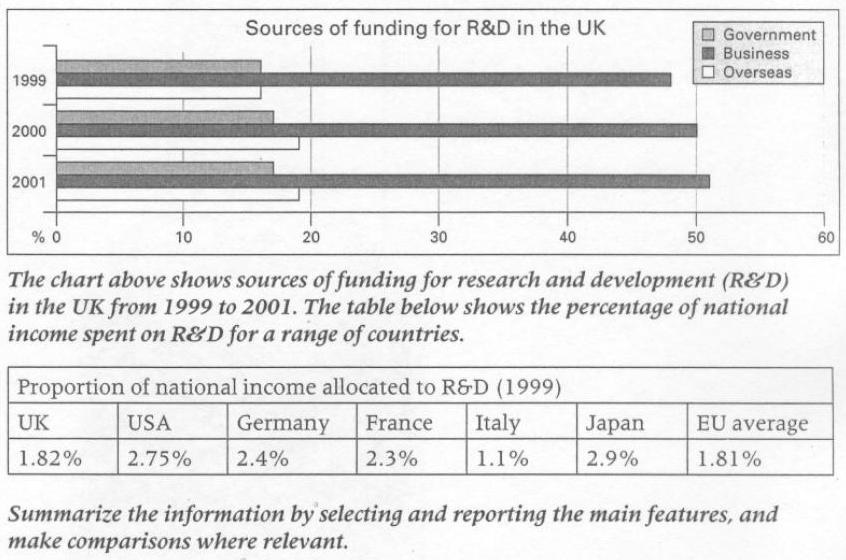
The bar chart compares the proportion of the funding for R&D in the UK from government, business, and overseas from 1999 to 2001. The table, on the other hand, provides information about the percentage of national income allocated to R&D in 1999 in seven countries.
Overall, although the money from all three sources to R&D increased year by year, the changes were not very significant. Of all three, business was always the most important funding source.
In 1999, the funding from the government and overseas were the same, standing at about 16% for each. However, business funded three times as much as other two sources. In 2000, the government and overseas increased their funding negligibly, whereas the business' proportion reached 50% and exceed it in the next year. According to the table, the UK in 1999 spent only 1.82% of its national income on R&D, whilst the country spent most on this was Japan with 2.9%. By contrast, Italy spent the least money on R&D compared to other countries in the table, with only 1.1% of total national income.
Top answer
You need to be much more specific. For example there are percentages for each of three years. There are not seven countries, only six.
- You need to be much more specific.
- For example there are percentages for each of three years.
- There are not seven countries, only six.
- The bar chart compares the proportion of the funding for R&D in the UK from three different sources: government, business, and overseas each year from 1999 to 2001.
- The table lists , on the other hand, provides information about the percentage of national income allocated to R&D in 1999 in six seven countries and the average for the EU.
Get the Weekly English Kit 📬
New words, one handy idiom, and a 2-minute quiz — delivered to your inbox to keep your streak alive.
You need to be much more specific. For example there are percentages for each of three years. There are not seven countries, only six.
The bar chart compares the proportion of the funding for R&D in the UK from three different sources: government, business, and overseas each year from 1999 to 2
 Related Questions