
TASK 1.9: The scores
Hello teacher, I have written a simple essay related to task 1 in the IELTS test. Please check and correct it for me. Thank you with love.
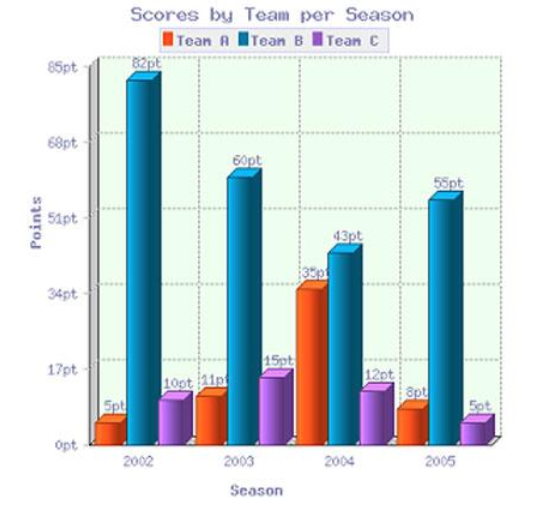
The bar chart shows the scores of teams A, B and C over four different seasons.
Summarize the information by selecting and reporting the main features and make comparisons where relevant
- You should write at least 150 words.
- You should spend about 20 minutes on this task.
Answer:
The scores of three different teams over four seasons (2002, 2003, 2004 and 2005) are showed on the bar graph. These three specific teams are A, B, and C. The units of measurement are points per season.
Overall, B always was the team with the highest points which scored total of 240 points over four seasons. The amounts of scores recorded by team A and team C were significantly smaller than A, with the total of 59 and 42 scores respectively.
The scores by team B per season declined over these seasons, started out from 82 points in the initial season, hit the bottom at 43 points in the 2004 season, and ended with a value of 55 points. However, although having the least in 2004, there was a difference of three and a half of team C which was in third place in this season.
Over the initial two seasons in 2002 and 2003, the points of team C were higher than team A but with a small difference, about 5 to 6 points per season. In the year 2004, however, team A had a big chance and was in second place with 35 points, which was about three times that of team C in the same season. The last season in 2005 showed the same patterns as season 2004, yet the difference between team A and team B was just 3 points.
Again, thank you so much.
Top answer
The total points score d by each of three different teams in each season over four seasons (2002, 2003, 2004 and 2005) are showed (Show is irregular. ) on the bar graph. (Your sentence was ok, but I wanted to show you a paraphrase.
- The total points score d by each of three different teams in each season over four seasons (2002, 2003, 2004 and 2005) are showed (Show is irregular.
- ) on the bar graph.
- (Your sentence was ok, but I wanted to show you a paraphrase.
- ) These three specific teams are A, B, and C.
- The units of measurement are points per season.
Get the Weekly English Kit 📬
New words, one handy idiom, and a 2-minute quiz — delivered to your inbox to keep your streak alive.
The total points scored by each of three different teams in each season over four seasons (2002, 2003, 2004 and 2005) are showed (Show is irregular. ) on the bar graph. (Your sentence was ok, but I wanted to sh
 Related Questions