
TASK 1.7: Oil production capacity
Hello teacher, I have written a simple essay related to task 1 in the IELTS test. Please help me to check and correct it. Thank you with love.
Summarise the information by selecting and reporting the main features, and make comparisons where relevant.
• You should write at least 150 words.
• You should spend about 20 minutes on this task.
Answer:
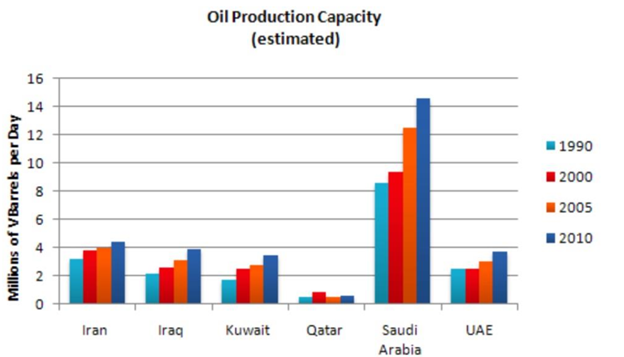
The amounts of estimated oil production in some countries over the period between 1990 and 2010 are shown on the bar graph. These specific countries are Iran, Iraq, Kuwait, Qatar, Saudi Arabia, and the UAE. The unit of measurement was million of barrels per day.
Overall, the production of oil increased over this period in these nations and had the highest value in the year 2010 excepted Qatar which was mostly stable over the period. Saudi Arabia’s oil production was significantly higher than in other nations. In contrast, Qatar was the least nation producing oil compared to the others. The production in oil of the remained countries just slightly increased throughout the period.
Saudi Arabia was in first place in oil production, started out barely above 8 million of barrels per day in 1990 and slightly rose over the next 10 years before having a big milestone in oil production over the following 5 years, then continued to increase and ended at around 14 million of barrels per day at the end of the period. In contrast, Qatar showed the smallest amounts of oil production when the value just varied around 0.5 million of barrels per day.
Iran, Iraq, and Kuwait showed their similar trend which firmly increased over the 20-year period. They began at around 2 and end at approximately 4 million of barrels. In the initial 10 years, the capacity of oil production in the UAE kept the same value of barely above 2 million of barrels per day, then slightly rose over the remained years and peaked at around 4 million of barrels in 2010.
Top answer
The amounts of estimated oil production (Incorrect. ) in some six countries over the period between 1990 and 2010 are shown on the bar graph. These specific countries are Iran, Iraq, Kuwait, Qatar, Saudi Arabia, and the UAE.
- The amounts of estimated oil production (Incorrect.
- ) in some six countries over the period between 1990 and 2010 are shown on the bar graph.
- These specific countries are Iran, Iraq, Kuwait, Qatar, Saudi Arabia, and the UAE.
- The unit of measurement was million (incorrect form) of barrels per day.
- Overall, the production of oil (Incorrect.
Get the Weekly English Kit 📬
New words, one handy idiom, and a 2-minute quiz — delivered to your inbox to keep your streak alive.
The amounts of estimated oil production (Incorrect. That is not what is plotted.) in some six countries over the period between 1990 and 2010 are shown on the bar graph. These specific countries are Iran, Iraq, Kuwait, Qatar, Saudi Arabia, and the UAE. The unit of measurement
 Related Questions