
Task 1 - Writing Pratice - Line Graph - Evaluation Needed
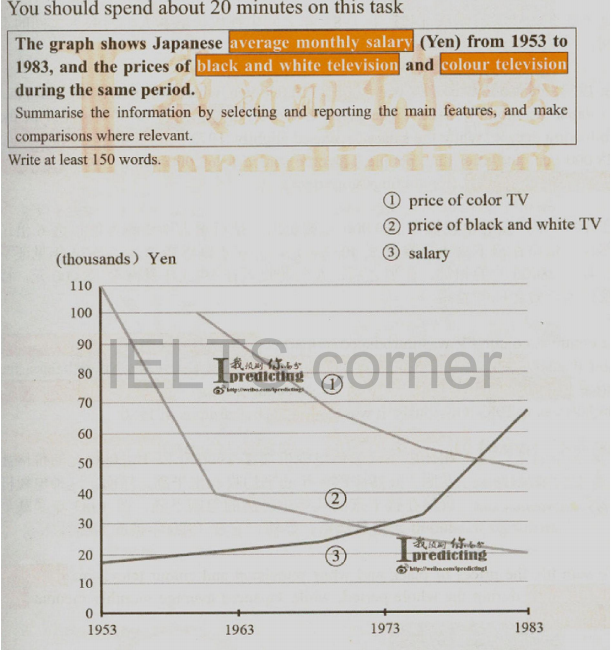
The line graph shows the changing trends of Japanese monthly pay grade in Yen, and the prices of black and white television and color television throughout a period of 30 years from 1953.
It is evident that the prices of color TV and black and white TV experienced a downward trend, while monthly salary for the Japanese rose noticeably with the changing level being almost the reverse of color TV over the period shown.
In 1960, while the price of color TV stood at 100 thousand, black and white TV was priced roughly three times less than that in 1953 with numbers steeply falling from 110 thousand to 40 thousand. The year 1983 continuously saw a gradual drop of the prices of both color and black and white TV with figures dipping at 49 thousand and 20 thousand respectively.
In contrast, although Japanese salary on a monthly basic stood at just under 20 thousand in 1953, it increased even further to 1983, with number reaching nearly 70 thousand.
Top answer
I am responding to your writing, not to the factual accuracy of it based on the graph. The line graph shows the changing trends of Japanese monthly pay grades in Yen and the prices of color and black and white televisions over a period of 30 years beginning in 1953. It is evident that the prices of all TVs experienced a downward trend, while monthly salaries for the Japanese rose noticeably with the changing level being almost the reverse of color TVs over the period shown.
- I am responding to your writing, not to the factual accuracy of it based on the graph.
- The line graph shows the changing trends of Japanese monthly pay grades in Yen and the prices of color and black and white televisions over a period of 30 years beginning in 1953.
- It is evident that the prices of all TVs experienced a downward trend, while monthly salaries for the Japanese rose noticeably with the changing level being almost the reverse of color TVs over the period shown.
- In 1960, while the price of color TVs stood at 100 thousand, black and white TVs were roughly one third the price they were in 1953 with numbers steeply falling from 110 thousand to 40 thousand.
- The year 1983 saw a gradual drop in price of both color and black and white TVs with figures dipping at 49 thousand and 20 thousand respectively.
Get the Weekly English Kit 📬
New words, one handy idiom, and a 2-minute quiz — delivered to your inbox to keep your streak alive.
I am responding to your writing, not to the factual accuracy of it based on the graph.
The line graph shows the changing trends of Japanese monthly pay grades in Yen and the prices of color and black and white televisions over a period of 30 years beginning in 1953.
It is evident that the prices of all TVs experienced a downward trend, while monthly salaries for the Japanese r
 Related Questions