
TASK 1: Transport in one Europe city
Hello teacher, I just wrote a essay for task 1 in the IELTS task. Please correct it for me. Thank you so much.
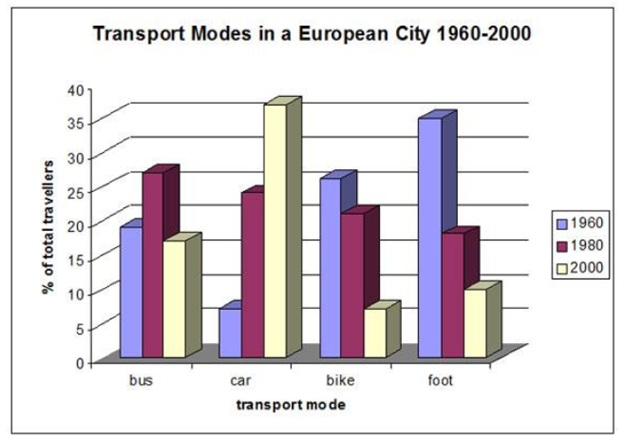
The following bar chart shows the different modes of transport used to travel to and from work in one European city in 1960, 1980 and 2000.
Summarize the information by selecting and reporting the main features and make comparisons where relevant.
Write at least 150 words.
My answer:
The percentages of four transport used to and from work in a city in Europe over three different years (1960, 1980, and 2000) are shown on the bar graph. These four specific transport mode are bus, car, bike, and foot.
Overall, while the use of car over three specific years sharply increased. In contrast, bike and foot had the same patterns of decreasing throughout these years.
Car showed the value of just slightly above 5% in the initial year. Nonetheless, there was a difference of more than four times, about 23% in the next twenty years. Ultimately, it reached the highest percentages of around 35% in 2000, which was seven-fold of that in the first year.
For bike and foot, in 1960, the highest values were recorded which were approximately 25% and 34% respectively. After that, the use of these two transport modes declined but with different rates, about 20% and 17% in the year 1980. They then continued decreasing and hit their bottoms of 6% and 9% respectively at the end of the period. On the other hand, bus started out 18% in the first year, peaked at barely above 25% in 1980, and ended at around 16% in the year 2000.
Top answer
Hello [ 1] teache r s, I just wrote a n essay for task 1 in the [ 2] IELTS tas k- 1 essay . Please correct it for me. Thank you so much.
- Hello [ 1] teache r s, I just wrote a n essay for task 1 in the [ 2] IELTS tas k- 1 essay .
- Please correct it for me.
- Thank you so much.
- The percentages of bar chart compares four types of transport used to and from work by commuters in a city in Europe over three different years (1960, 1980, and 2000 ).
- are shown on the bar graph.
Get the Weekly English Kit 📬
New words, one handy idiom, and a 2-minute quiz — delivered to your inbox to keep your streak alive.
Hello [ 1] teachers, I just wrote an essay for task 1 in the [ 2] IELTS task-1 essay. Please correct it for me. Thank you so much.
The pe
 Related Questions