
[TASK 1] Transport and car us in Edmonton
Hello teacher, this is my essay. I know there are lots of mistakes in this essay, but I couldn't find one by myself. Please check it for me Thank you so muchhh.
The diagrams below give information on transport and car use in Edmonton.
Summarise the information by selecting and reporting the main features, and make comparisons where relevant.
Answer:
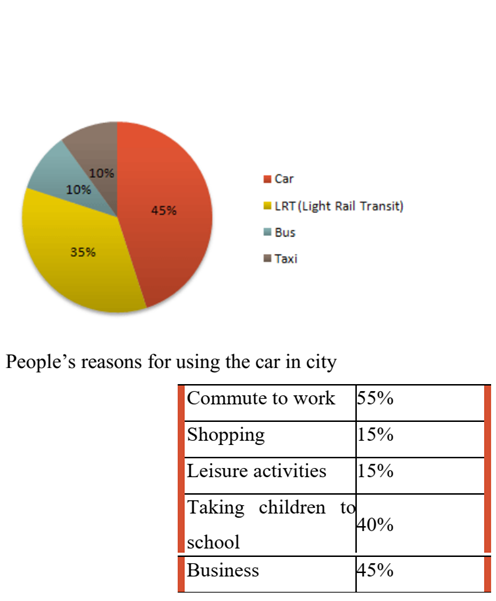
The pie graph gives the percentages of 4 different types of transportation in Edmonton, including car, LRT (light rail transit), bus, and taxi. Besides, a table provides the information of 5 common activities that people need to use cars in city. These five are commute to work, shopping, leisure activities, taking children to school, and business.
Overall, cars are the most popular transportation that was used in urban, while buses and taxies have the same lowest proportion. People in Edmonton, mostly, use cars for work and taking children to school.
Almost half of Edmonton people use cars, accounting for 45%. Being in the second place after only cars, LRTs occupy slightly a third of the total, about 35%. Buses and taxies show the same proportion, just only 10% for each kind of transportation.
Using cars for work reasons is more than for any other reason in this city, with 55% for commuting to work and 45% for business. However, taking children to school also takes a high proportion, being only less than 5% compared to that of business. Using care for shopping is recorded at 15% and the same figure is given for leisure activities.
Top answer
Please post essays, paragraphs, dialogues and other writing in the essay forum so a moderator does not have to move your post. htm
- Please post essays, paragraphs, dialogues and other writing in the essay forum so a moderator does not have to move your post.
- htm
Get the Weekly English Kit 📬
New words, one handy idiom, and a 2-minute quiz — delivered to your inbox to keep your streak alive.
Please post essays, paragraphs, dialogues and other writing in the essay forum so a moderator does not have to move your post.
https://www.englishforums.com/English/EssayReportCompositionWriting/Forum9.htm
The pie graph [ 1] chart gives the percentages of [ 2] four different types of transportation in Edmonton, [ 3] including namely: car, LRT (light rail transit), bus, and taxi. Besides, the
This task was not written by a native English speaker. It is defective. It is very difficult to learn to write good essays if the task instructions and graphs are flawed.
The pie graph (wrong word) gives the percentages of 4 four
 Related Questions