
[TASK 1] The international conferences in three different cities
Hello teachers, please check these essays in the IELTS test for me. Thank you for your help <3
----------------------------------
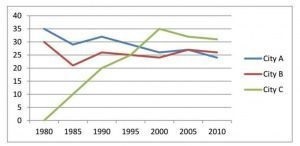
The graph shows the information about the international conferences in three capital cities in 1980 – 2010.
----------------------------------
MY ESSAY
The yearly information related to international conferences changes in three specific cities, namely city A, B, and C between the year 1980 and 2010 was described in the following line chart.
Overall, the amounts of conferences in these three cities clearly showed two different trends. The first was the decline of internal conferences which was showed by cities A and B. In contrast, city C gave a sharp increase in the same period.
Being the first-rank and second-rank cities, cities A and B began at 35 and 30 conferences in 1980, which were their highest amounts during the present period. Yet over the following years, they decreased slightly with minor fluctuations of plus and minus 10 conferences and ended at nearly the same value, around 25 conferences in the year 2010.
On the other hand, city C had a steady increase over the 20-year period, and hit its peak at 35 conferences which equaled the highest conference that city A had in the initial year. In the next 10 years, there was a slight decline in the number of conferences but it still ranked first in these following years at just barely over 30 conferences.
----------------------------------
MY FRIEND'S ESSAY
The graph studies the number of conferences held by three cities: A, B and C from 1980 to 2010. It could be interpreted as the rise and fall of the importance and prestige of the mentioned cities.
From the beginning years, city A and B clearly dominated with city A having a slight edge. In 1980, city A and B, held 35 and 30 conferences respectively. These number saw various minor changes over the years, till 2000, where they both landed at around 25 conferences.
But, it is in that very same period between 1980 and 2000 that we witnessed the rise to prominence of city C with its steady increase in the number of hosted conference, starting from the humble number of zero conference in 1980 and peaked at 35 in 2000 at the cost of the declining number in city A and B.
The last 10 years of the graph shows little to no changes beside a small decline of the amount of hosted conferences of city C. The line of city A and B saw some small rise in 2005 but remained relatively unchanged throughout the periods.
----------------------------------
It's my pleasure to have your help
Top answer
The graphic you attached is barely readable. It is out of focus and very small. Please attach clearer and larger images next time.
- The graphic you attached is barely readable.
- It is out of focus and very small.
- Please attach clearer and larger images next time.
- The yearly information related to i nternational conferences changes in three specific cities, namely city A, B, and C between the year 1980 and 2010 was described in the following line chart .
- Your first paragraph is not good.
Get the Weekly English Kit 📬
New words, one handy idiom, and a 2-minute quiz — delivered to your inbox to keep your streak alive.
The graphic you attached is barely readable. It is out of focus and very small. Please attach clearer and larger images next time.
The yearly information related to international conferences changes in three specific cities, namely city A, B, and C between the
Vu LeMY FRIEND'S ESSAY
The graph (what type of graph?) studies ( wrong verb) the number of conferences held by three cities: A, B and C from 1980 to 2010. It could be interpreted as the rise and fall of the importance and prestige of the mentioned
 Related Questions