
Task 1: The chart below gives information about the number of social networking sites people used in Canada in 2014 and 2015.
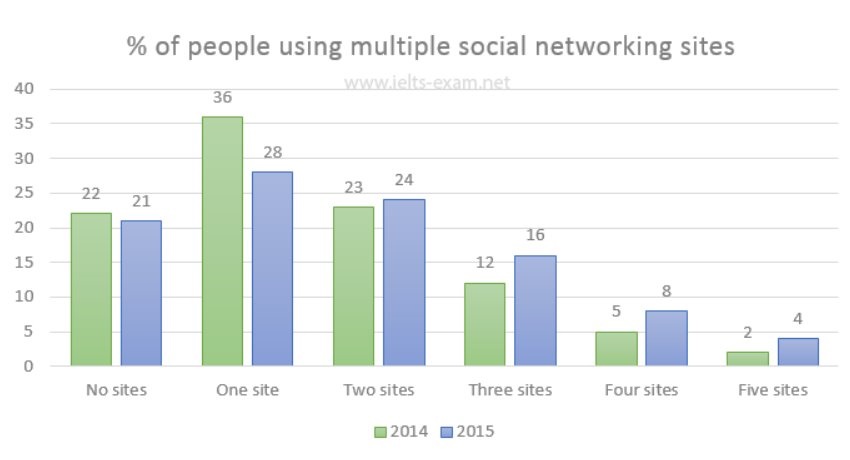
The given chart illustrates how people using multiple social networking sites in Canada in 2014 and 2015 in six items sites, with units measured in per cent.
Overall, among six various sites, the percentage of people using one site was highest, whereas the figure for that using five sites was lowest in both of the two years in the survey.
It is evident that the proportion of people using one site was highest in the survey, reached a peak at 36% in 2014, slightly higher than the figure for this in 2015, with 28%. Flow by the people using two sites, the data for this ranked second place in the survey, with 23% in 2014 and 24% in 2015. In the year 2014, the percentage of people using one site stood at third place, was 22% in 2014 and 21% in 2015.
In contrast, the rates of people using the remaining items sites were under 20% each. The percentage of people using three sites was 12% in 2014, lower than that in 2015, with 16%. Likewise, the figure for people using four sites was 5% in 2015, while the figure for that in 2015 was 8%. Finally, the portion of people using five sites was lowest in the chart review, was 2% in 2014 and 4% in 2015.
Top answer
Please do not put the essay instructions in the "Subject" line. Put it with your answer in the message body. Subject: Please review my IELTS essay Message body: Topic: The chart below gives information about the number of social networking sites people used in Canada in 2014 and 2015.
- Please do not put the essay instructions in the "Subject" line.
- Put it with your answer in the message body.
- Subject: Please review my IELTS essay Message body: Topic: The chart below gives information about the number of social networking sites people used in Canada in 2014 and 2015.
- Copy the instructions accurately and completely.
- ) --------------------- Please read my advice for Task 1 essays.
Get the Weekly English Kit 📬
New words, one handy idiom, and a 2-minute quiz — delivered to your inbox to keep your streak alive.
Please do not put the essay instructions in the "Subject" line.
Put it with your answer in the message body.
Subject: Please review my IELTS essay
Message body:
Topic:
The chart below gives information about the number of social networking sites people used in Canada in 2014 and 2015.
Copy the instructions accurately and completel
The given (Do not use "given" or "provided". It is not natural English.) bar chart (There are many kinds of charts. Tell the reader what kind is shown.) illustrates (Use "illustrate" for pictures and diagrams. It is not a good word for charts and graphs.)
 Related Questions