
[TASK 1] The amount of CO2 emissions
Hello teacher, this is my essay. Please check it for me Thank you so muchhh.
Answer:
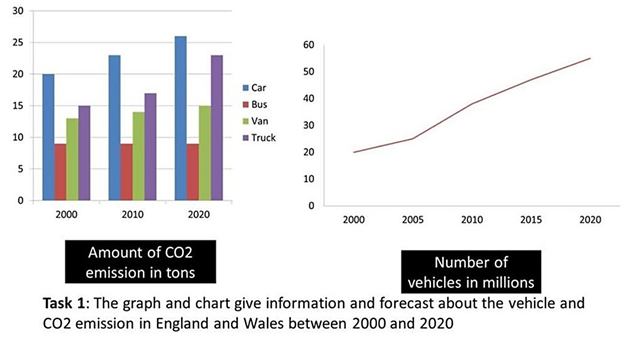
The graph chart compares the CO2 emission of four different vehicles (car, bus, van, and truck) in three specific years (2000, 2010, and 2020). also, the line chart shows the actual quantity of vehicles continuously in the 20-year period. Both of the charts use the data in England and Wales from 2000 to 2020.
Due to the information provided by these two charts, the number of vehicles increased constantly throughout this period that led to a rise in CO2 emission. However, this kind of greenhouse gas produced by public transportation, specifically for the bus, kept constant in these years.
In the year 2000, the CO2 emission from cars was 20 tons, which was in the first place and kept its position until the end of this period. Furthermore, the cars’ emission was always double the figure shown by the buses in the same years. Having the same pattern, trucks gave the sharply increase in the greenhouse emission, starting out at 15 tons of CO2 in 2000 and ended at approximately 23 tons in 2020. On the other hand, vans showed a barely rise, around more than 2 tons after 20 years of investigation.
The number of vehicles increased with different rates. In the initial 5 years, it just rose from around 20 to 25 millions vehicles. There was a rapid increase in the next 5 years before the vehicles had a almost linear rise until the end of this period.
Top answer
") compares the CO2 emission (wrong form) of four different types of vehicles (car, bus, van, and truck) in three specific years (2000, 2010, and 2020). ") shows the actual quantity of vehicles continuously in the 20-year period. Both of the charts use the data in England and Wales from 2000 to 2020.
- ") compares the CO2 emission (wrong form) of four different types of vehicles (car, bus, van, and truck) in three specific years (2000, 2010, and 2020).
- ") shows the actual quantity of vehicles continuously in the 20-year period.
- Both of the charts use the data in England and Wales from 2000 to 2020.
- Due to the information provided by these two charts, (That is incorrect.
- The reason for the increase in vehicles in England and Wales is not because this graph exists.
Get the Weekly English Kit 📬
New words, one handy idiom, and a 2-minute quiz — delivered to your inbox to keep your streak alive.
The graph chart (There is no such thing as a "graph chart.") compares the CO2 emission (wrong form) of four different types of vehicles (car, bus, van, and truck) in three specific years (2000, 2010, and 2020).
 Related Questions