
Task 1 TEST 6
The chart shows the unemployment situation in Australia in the year 2012.
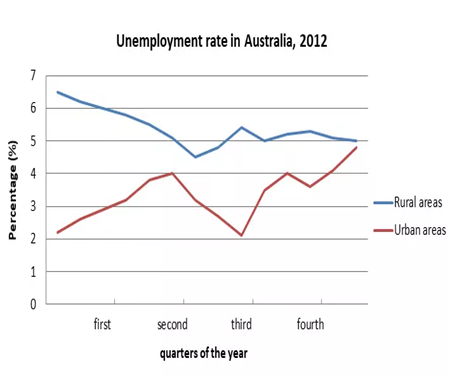
The line graph compares two different rural and urban regions of Australia in terms of the unemployment rate over a 4-quarter period in the year 2012.
Overall, despite various ups and downs, a downward trend was observed for the joblessness in the countryside. However, it was not the case for the unemployment level in cities. Additionally, the proportion of unemployed Australians living in the suburban regions was slightly higher than that in cities over the survey.
At the initial quarter of the year, a total of about 10% of people are jobless in Australia, over three-fifth being lived in rural areas, a quarter in the urban regions. In the subsequent three months, the figure for jobless people in the country fell significantly a further 2% to its bottom level at below 5%, prior to experiencing a mild recovery to 5.5% at the beginning of the third quarter, followed by some mild variations and a static phase at 5% in the last month of the year.
In contrast, in the second quarter, the latter had a great increase of 2% despite also dipping to its initial level in the third quarter. After continuing going up and down, the rate of the unemployed in cities increased rapidly and reached its peak at roughly 5%, almost the same as rurales' figure.
Top answer
Please check my writing. Thank you so much
- Please check my writing.
- Thank you so much
Get the Weekly English Kit 📬
New words, one handy idiom, and a 2-minute quiz — delivered to your inbox to keep your streak alive.
You have posted a lot of essays, and I have given a lot of time and effort in feedback.
But have you read my advice?
You have not replied with any questions or thanks. Do you look at my feedback? Did you learn anything? Do you know why the New Zealand population task is bad?
There are many other students posting essays, and they appreciate my comments.
The line graph compares two different rural and urban regions (That is incorrect. Two rural regions would be Kiwirrkurra Community and Alice Springs. Two urban regions would be Sydney and Melbourne.) of Australia in terms of the unemployment rate over a 4-quarter period (Incorrect - every ye
Sample essay;
The line graph plots the quarterly unemployment rate in the rural regions versus the urban regions of Australia in 2012.
Overall the rural areas had a higher value throughout the year, but the large gap at the beginning of the year had closed by the end of the year.
In detail, at the start of 2012, the unemployment rate in rural areas was
 Related Questions