
Task 1 TEST 4
The graph below shows the unemployment rates in the US and Japan between March 1993 and March 1999.
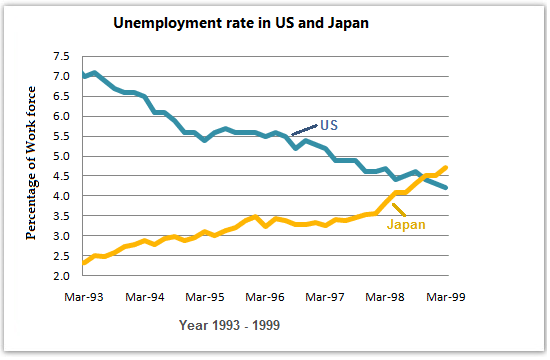
The line graph compares the US and Japan in terms of the change of unemployment levels over a 7-year period starting from March 1993.
Overall, despite some fluctuations at varying degrees, there was a major decrease in the proportion of the American workforce whereas it was not the case for that in Japan over the survey.
In March 1993, a high 7% of American people are jobless while the unemployment rate in Japan was roughly three times lower than the former, with around 2.4%. From 1994 to 1995, the proportion of jobless Americans declined to below 5.5% after mild ups and downs. By contrast, in Japan, the number of unemployed people witnessed a continuous rise at over 3%.
The rates of joblessness in these two countries intersected between March 1998 and March 1999 when the unemployment rate in both countries was just about 4.5%. At the end of March 1999, the figure for the unemployment rate in America was slightly lower than that in Japan, 4.6% and 4.1% respectively.
Top answer
The line graph compares the US and Japan in terms of the change of unemployment rates levels over a 7-year period starting from March 1993. Overall, despite some fluctuations at varying degrees, there was a major decrease in the proportion of the American workforce (That is incorrect. The graph plots unemployment rates .
- The line graph compares the US and Japan in terms of the change of unemployment rates levels over a 7-year period starting from March 1993.
- Overall, despite some fluctuations at varying degrees, there was a major decrease in the proportion of the American workforce (That is incorrect.
- The graph plots unemployment rates .
- ") whereas it was not the case for that in Japan over the survey .
- (The instructions do not mention any surveys.
Get the Weekly English Kit 📬
New words, one handy idiom, and a 2-minute quiz — delivered to your inbox to keep your streak alive.
The line graph compares the US and Japan in terms of the change of unemployment rates levels over a 7-year period starting from March 1993.
Overall, despite some fluctuations at varying degrees, there was a major decrease in the proportion of the American workforce
 Related Questions