
Task 1 TEST 1
The line graph below shows the number of single-family homes constructed in the United States by region over a period of six years.
Summarize the information by selecting and reporting in the main features and make comparisons where relevant.
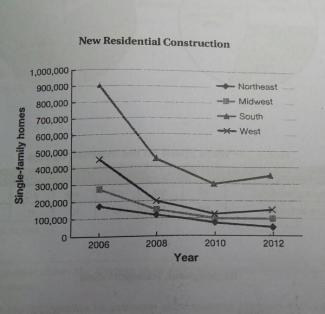
The line graph illustrated the construction of single-family houses in 4 different areas including Northeast, Midwest, South, and West in the USA over a 6-year period starting from 2006.
In general, the initial impression from the chart is that a downward trend was observed for all areas despite fluctuations at varying degrees. Additionally, a high number of single inhabitants built houses in the South while erecting of new residentials in the Northeast was the lowest over the surveyed period.
As can be seen, in 2006, approximately 900.000 citizens had their house in the South, four times more than the number in the Northeast. At the same time, the figures for the other two West and Midwest residentials were also lower, with fewer than half and 300.000 of them respectively. The subsequent two years saw the most significant decline among the four areas. South houses built fell by a further 450.000, about twofold its 2006 level and nine-fourth of the number of West house produced in 2008. There was a major decrease in the quantity of homes in the two remaining areas, both at approximately 100.000.
It is notable that four areas experienced a continuous decline in construction during the next two years. The number of houses built by South people fell greatly, reaching its lowest point at roughly 300.000 before recovering to under 400000 in 2012. Similarly, three other areas in America showed an overall decline of 100000 numbers in 2010 prior to stabilizing at approximately 150.000.
Top answer
The line graph illustrated (Wrong verb and wrong tense. Use "illustrate" for process flows, diagrams and pictures, not for plots and graphs. ) the construction of single-family houses in 4 ( write out small numbers in words.
- The line graph illustrated (Wrong verb and wrong tense.
- Use "illustrate" for process flows, diagrams and pictures, not for plots and graphs.
- ) the construction of single-family houses in 4 ( write out small numbers in words.
- ) four different areas ( including Northeast, Midwest, South, and West ) in the USA over a 6-year period starting from 2006.
- In general, the initial impression from the chart is that (Those words have no information.
Get the Weekly English Kit 📬
New words, one handy idiom, and a 2-minute quiz — delivered to your inbox to keep your streak alive.
The line graph illustrated (Wrong verb and wrong tense. Use "illustrate" for process flows, diagrams and pictures, not for plots and graphs. ) the construction of single-family houses in 4 ( write out small numbers in words. ) four
Sample essay
Outline
Paragraph #1: Describe all aspects of the figure. Mention the names of the categories (in this case, the regions) to familiarize the reader with the subject.
Paragraph # 2 Report main features. Pick out two or three for this paragraph.
Paragraph # 3 Report some details, focusing on comparisons. In Task 1 you get the highest score by combining catego
 Related Questions