
[TASK 1] Sales of jeans in Turkey
Hello teacher, this is my essay. I know there are lots of mistakes in this essay, but I couldn't find one by myself. Please check it for me Thank you so muchhh.
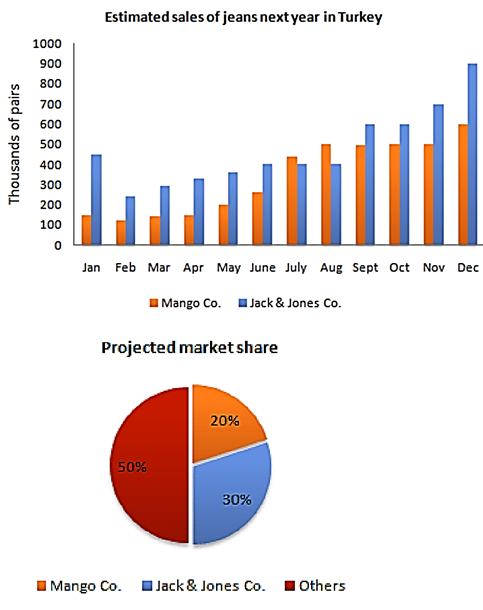
The bar chart below shows the estimated sales of jeans for two companies next year in Turkey. The pie chart shows the projected market share of the two companies in jeans at the end of next year.
Write a short report for a university lecturer describing the information shown below.
Answer:
The bar compares the estimated sales of jeans in thousands of pairs between Mango and Jack & Jones companies. In addition, the proportions of the projected market share of three different categories, including Mango company, Jack & Jones company, and the others, are showed through the pie chart.
Overall, both of Mango and Jack & Jones companies are predicted to have the same pattern that continuously increases in the sales of jeans throughout the next year except in January. Furthermore, these companies are expected to be the market leaders in the following year.
It is anticipated that sales of jeans by Mango will start at about 150 thousands of pairs in January, then continuously increase to approximately 500 thousands of pairs in August. After that, it is forecast to keep the constant value before touching its peak, which will be four-folded in the comparision with the value in the innitial month. On the other hand, it is estimated that the sales for Jack & Jones company will begin at around 450 thousands of pairs, then sharply decline to 250 thousand of pairs in the next month. From this month, the estimated sales will have a mostly linear increase to 400 thousand pairs before keeping the same value in the next 3 months. At the end of the coming year, the sales of jeans by Jack & Jones company are expected to peak at approximately 950 thousand of pairs in December.
Jack & Jones company is forecast to be in the first place in the projected market, which is estimated to have a third of the total. The will be a difference of 10% between the first-ranked company and Mango company, at 20% in the coming year. For the others, all of them are expected to have half of the sales market.
Top answer
The [ 1] bar chart compares the [ 2] next year’s estimated sales of [ 2] Mango and Jack & Jones jeans in thousands of pairs in Turkey. between Mango and Jack & Jones companies. In addition, the proportions of t he projected market shar e s of three different categories, brands, including Mango [ 3] company, and Jack & Jones company, and the others, are showed shown [ 4] through in the pie chart.
- The [ 1] bar chart compares the [ 2] next year’s estimated sales of [ 2] Mango and Jack & Jones jeans in thousands of pairs in Turkey.
- between Mango and Jack & Jones companies.
- In addition, the proportions of t he projected market shar e s of three different categories, brands, including Mango [ 3] company, and Jack & Jones company, and the others, are showed shown [ 4] through in the pie chart.
- Overall, the sales of both of M ango and Jack & Jones companies are predicted to have the same pattern that continuously increases in the sales of jeans throughout to increase in the next yea r.
- except in January.
Get the Weekly English Kit 📬
New words, one handy idiom, and a 2-minute quiz — delivered to your inbox to keep your streak alive.
The [ 1] bar chart compares the [ 2] next year’s estimated sales of [ 2] Mango and Jack & Jones jeans in thousands of pairs in Turkey. between Mango and Jack & Jones companies. In a
 Related Questions