
Task 1: rating of hotel's customer service in 2005 and 2010
Please give me some feedback and a score. Thank you so much!
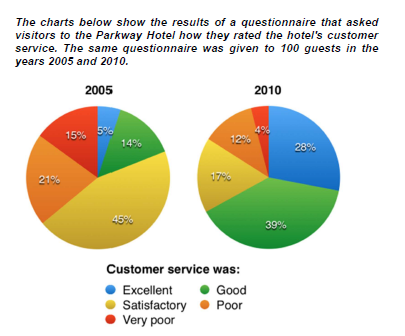
The pie chart presents the rating of customer service of the Parkway Hotel given by 100 guests in 2005 and 2010.
Overall, it is noticeable that the negative feedback in 2005 was significantly lower in 2010. Although the percentage of guests who rated the Parkway Hotel positively increased in 2010, there was a reduction in visitors who were satisfied with the customer service.
After the 5-year period, the number of customers who rated very poor were lowered, from 15% to 4% in 2010. Similarly, the percentage of poor ratings also reduced by half in 2010. With such reduction in 2010, the Parkway Hotel had successfully decrease the total amount of negative feedback from 36% in 2005 to 16% in 2010.
Because of the reduction in negative feedback, the positive rating also increased greatly in 2010. However, the number of people who felt satisfied with the service were decreased drastically after 5 years, from 45% to only 17%. Meanwhile, both the rating of excellent and good were increased, 5% and 14% in 2005 to 28% and 39% in 2010 respectively.
Top answer
) presents the rating of customer service of the Parkway Hotel given by 100 guests in 2005 and 2010. " Be specific as to what you mean by "negative"). feedback in 2005 was significantly lower in 2010.
- ) presents the rating of customer service of the Parkway Hotel given by 100 guests in 2005 and 2010.
- " Be specific as to what you mean by "negative").
- feedback in 2005 was significantly lower in 2010.
- " Be specific as to what you mean by "negative").
- increased in 2010, there was a reduction in visitors who were satisfied with the customer service.
Get the Weekly English Kit 📬
New words, one handy idiom, and a 2-minute quiz — delivered to your inbox to keep your streak alive.
The pie chart (Is there only ONE pie chart?) presents the rating of customer service of the Parkway Hotel given by 100 guests in 2005 and 2010. (Incomplete description - describe the number and names of the rating categories)
Overall, it is noticeable that the negative (I don't see any category named "negative." Be specific as to what you mean by
 Related Questions