
Task 1 production and consumption of electricity
Please help with this task 1.
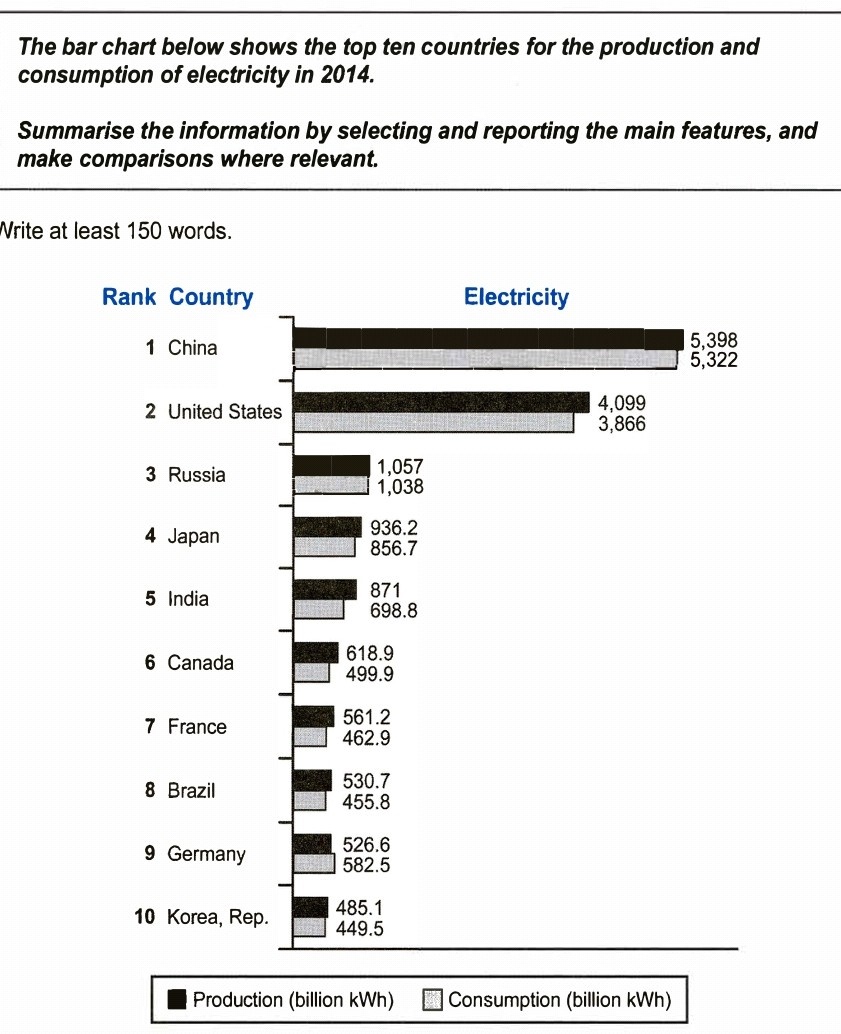
The given bar graph presents the information about ten countries that produced and utilized maximum electricity in 2014.
Overall, it can be seen that China and the USA were in the lead for producing and consuming the largest amount of electricity, whereas South Korea was in the bottom. It can also be noticed that with the exception of Germany all countries produced more electricity than they consumed.
China and the United States's production and utilization of electricity was far greater than all other eight countries. With the production of 4099 and consumption of 3866 billion kilowatts of energy, the United State's figures were four times more than that of Russian. However, it was still almost a thousand billion kilowatt less than China.
For the rest of the countries, the production and utilization ranged between 1057 and 1038 to 485 and 449 respectively; Russia being at the third and South Korea at the last spot. With Germany, it was short of almost 50 billion kilowatts with 526.6 billion kilowatt in production and 582.5 billion kilowatt in usage.
Top answer
The given (Do not use given , or any other similar participle) bar graph presents the information about (This is very vague. Information about countries may be their size, population, percent of elderly, and so on. Most countries generate and use electricity, so ten of them would not be remarkable..
- The given (Do not use given , or any other similar participle) bar graph presents the information about (This is very vague.
- Information about countries may be their size, population, percent of elderly, and so on.
- Most countries generate and use electricity, so ten of them would not be remarkable..
- ) ten countries that produced and utilized maximum electricity (This means that they reached their limits of production.
- ) in 2014.
Get the Weekly English Kit 📬
New words, one handy idiom, and a 2-minute quiz — delivered to your inbox to keep your streak alive.
The given (Do not use given, or any other similar participle) bar graph presents the information about (This is very vague. Information about countries may be their size, population, percent of elderly, and so on. Most countries generate and use electricity, so ten of them would not be remarkable.. ) ten countries
 Related Questions