
Task 1, please help me review my essay.
Task 1: Annual average spending on clothes per person in the US in 1985, 1995 and 2005.
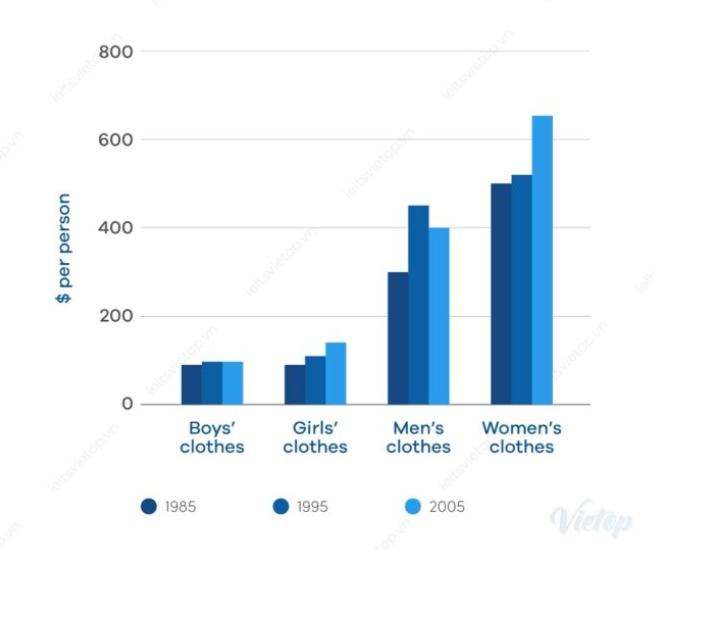
The bar chart compares the expenditure on outfits of four kinds of person groups. It gives data for the US residents, and for three years 1985, 1995 and 2005. Units are measured in dollar per person.
Overall, it is noticeable that women ranked first in the amount of money spent on clothes in three years. The exceptions were the boy and girl's expenditure, which stayed at the least.
In 1985, only one of the groups (women) had a majority of their expenses on clothes. This means that women have a tendency to buy more costume than others. The second position is the men, with nearly 300 dollars, much higher than the girl and boy about 200 dollars.
On the following year, the expense of clothes in four groups continued to rise and each group remained its place. By 2005, the women were still the dominant group spent on outfits compared to the remaining ones and had a relative gain of 150 dollars. However, the men's spent dropped by 50 dollars, fewer than in 1995. The boys were remained stable at 100 dollars, whereas the girls had a slight rise of over 20 dollars each year.
Top answer
The bar chart compares the expenditure on outfits (wrong word) of four kinds of person groups . (very bad English. ) It gives data for the US residents, and for three years 1985, 1995 and 2005.
- The bar chart compares the expenditure on outfits (wrong word) of four kinds of person groups .
- (very bad English.
- ) It gives data for the US residents, and for three years 1985, 1995 and 2005.
- Units are measured in (we do not measure units.
- ) dollar (wrong form) per person.
Get the Weekly English Kit 📬
New words, one handy idiom, and a 2-minute quiz — delivered to your inbox to keep your streak alive.
The bar chart compares the expenditure on outfits (wrong word) of four kinds of person groups. (very bad English. It makes no sense.) It gives data for the US residents, and for three years 1985, 1995 and 2005. Units are measured in (we do not measure units. We measure dist
 Related Questions