
TASK 1 (Pie graphs) Visiting public library in Britain
I just wrote an essay for the task 1 in the IELTS test. Please check and correct it for me. I really appreciate your efforts and kindness. Thank you so much.
Answer:
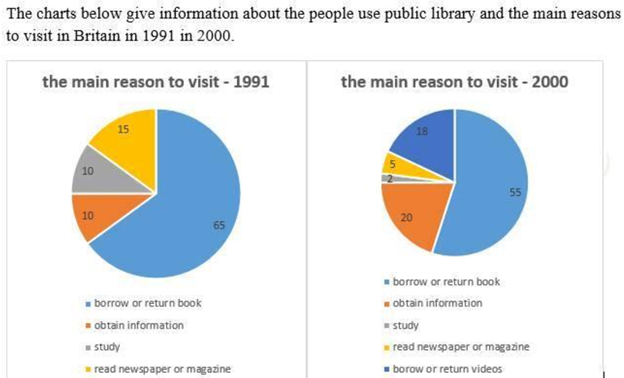
These two pie graphs compare the percentage of the main reasons that people in Britain came to the library between two specific years (1991 and 2000). These reasons are borrowing or returning books, obtaining information, study, reading newspapers or magazines, and borrowing or returning videos.
Overall, there were only 4 reasons that people use the library in 1991. However, a new function named borrowing and returning videos was added in 2000. People in these two years utilized the original function of the library, which is to borrow or return books, while studying in the library was the least reason that people visit there.
For borrowing or returning books, this value slightly decreased from 65 percent in 1991 to 55 percent in 2000. In contrast, the figure for the reason “obtain information” in 2000 was twice as much in 1991 (20 versus 10). Studying had the same value as obtaining information function, declining by a factor of 5 times, from 10 to 2 percent. Reading newspapers or magazines in 1991 was threefold, in comparison with in 2000. Borrowing or returning videos just appeared in 2000 yet taking one-fifth of the total.
Top answer
nh Quang pie graphs There is no such thing as a pie graph. asp
- nh Quang pie graphs There is no such thing as a pie graph.
- asp
Get the Weekly English Kit 📬
New words, one handy idiom, and a 2-minute quiz — delivered to your inbox to keep your streak alive.
Vu Lê Hu?nh Quangpie graphs
There is no such thing as a pie graph.
Look here: https://nces.ed.gov/nceskids/help/user_guide/graph/pie.asp
and here:
 Related Questions