
Task 1 - Pie chart
Could you please check my essay? Thank you so much!!!
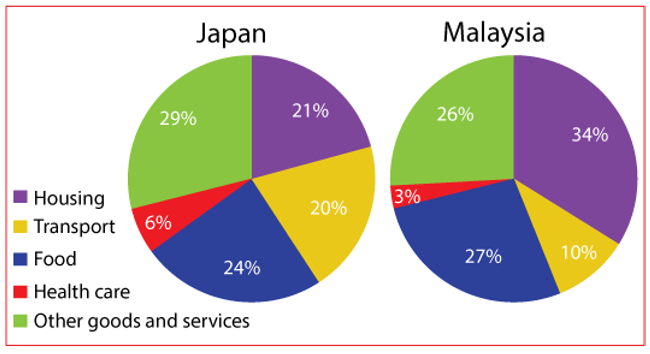
The pie charts below show the average household expenditures in Japan and Malaysia in the year 2010.
The charts compare the average household spending in terms of five categories in Japan and Malaysia in 2010.
Overall, food, housing and other goods and services made up the bulk of household spending in both countries. In particular, the proportion of household budget spent on transport and health care in Japan were double the figures in Malaysia.
In Malaysia, the greatest percentage of expenditure was housing, at 34%, which was much more than the proportion of this category in Japan with only 21%. Other goods and services was responsible for the highest proportion of domestic spending in Japan, accounting for 29%, while the equivalent figure in Malaysia
was slightly less, at 26%. Food stood at the second largest rank on household expenditure in both Japan and Malaysia with 24% and 27%, respectively.
Health care is the lowest category in both countries. This category accounted for 6% in Japan, which was double the percentage of health care in Malaysia, at only 3%. It is noticeable that there was a similar pattern in the spending on transport with 20% in Japan and 10% in Malaysia.
Top answer
Here are my suggestions: The charts compare the average household spending in terms of five categories in Japan and Malaysia in 2010. Overall, food, housing , and other goods and services made up the bulk of household spending in both countries. -- Move this.
- Here are my suggestions: The charts compare the average household spending in terms of five categories in Japan and Malaysia in 2010.
- Overall, food, housing , and other goods and services made up the bulk of household spending in both countries.
- -- Move this.
- ] In Malaysia, the greatest percentage of expenditure was housing, at 34%, which was much more than the amount spent in Japan on proportion of [ A little awkward ] this category in Japan with , which was only 21%.
- Other goods and services was responsible for the highest proportion of domestic spending in Japan, accounting for 29%, while the equivalent figure in Malaysia was slightly less, at 26%.
Get the Weekly English Kit 📬
New words, one handy idiom, and a 2-minute quiz — delivered to your inbox to keep your streak alive.
Here are my suggestions:
The charts compare the average household spending in terms of five categories in Japan and Malaysia in 2010.
Overall, food, housing, and other goods and services made up the bulk of household spending in both countries. [In particular, the proportion of household budget spent on transport and health care in Japan were double the figures in Mal
 Related Questions