
Task 1 line graph
Could you please correct my below essay? Thanks a lot.
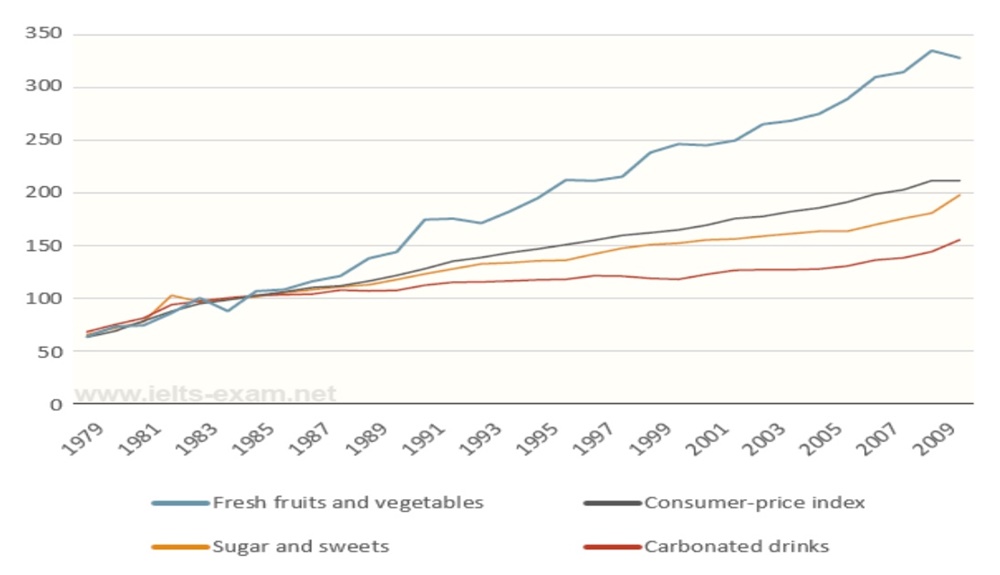
The line graph above gives information about changes in price of three different food product groups in the USA from 1978 to 2009, and the overall trend of the Consumer - price index over this period.
In general, all the lines on the chart are similar in term of a increase despite fluctuations and only the rise in the prices for Fresh fruits and vegetable were higher than the growth in the numbers for Consumer - price index over the 30 - year period.
At the start of the period, the prices for all three groups and CPI stood at the same point. The Consumer - price index was gradually rose from nearly 70 in 1979 to around 210 in 2009. The figures for Sugar and sweets and Carbonated drinks also experienced upward trends although were consistently below the numbers for Consumer - price index. After many slight fluctuations, the prices for Sugar and sweets ended the period at 150 on the graph, which was higher than the figures for Carbonated drinks.
The prices increased sharply during the period of 30 years for Fresh fruit and vegetable, especially after 1989. From the same starting point with another lines, the figures finished at over 350, which is the highest point of whole the chart, above the final point of Consumer - price index.
Top answer
The line graph above gives information about changes in price of three different food product groups in the USA from 1978 to 2009, and the overall trend of the Consume r - p rice index over this period. In general, all the lines on the chart are similar in term of a increase despite fluctuations and only the rise in the prices for Fresh fruits and vegetable were higher than the growth in the numbers for (missing word) Consume r - p rice index over the 3 0 - y ear period. At the start of the period, the prices for all three groups and CPI stood at the same point.
- The line graph above gives information about changes in price of three different food product groups in the USA from 1978 to 2009, and the overall trend of the Consume r - p rice index over this period.
- In general, all the lines on the chart are similar in term of a increase despite fluctuations and only the rise in the prices for Fresh fruits and vegetable were higher than the growth in the numbers for (missing word) Consume r - p rice index over the 3 0 - y ear period.
- At the start of the period, the prices for all three groups and CPI stood at the same point.
- (That's not correct; they are different, but the differences are small.
- When relative changes are plotted among several variables, there is one point on the graph where all the lines meet exactly at 100.
Get the Weekly English Kit 📬
New words, one handy idiom, and a 2-minute quiz — delivered to your inbox to keep your streak alive.
The line graph above gives information about changes in price of three different food product groups in the USA from 1978 to 2009, and the overall trend of the Consumer - price index over this period.
In general, all the lines on the chart are similar in term of a increase despite fluctuations an
 Related Questions