
Task 1: Line graph
Could you please check my essay? Thank you so much.
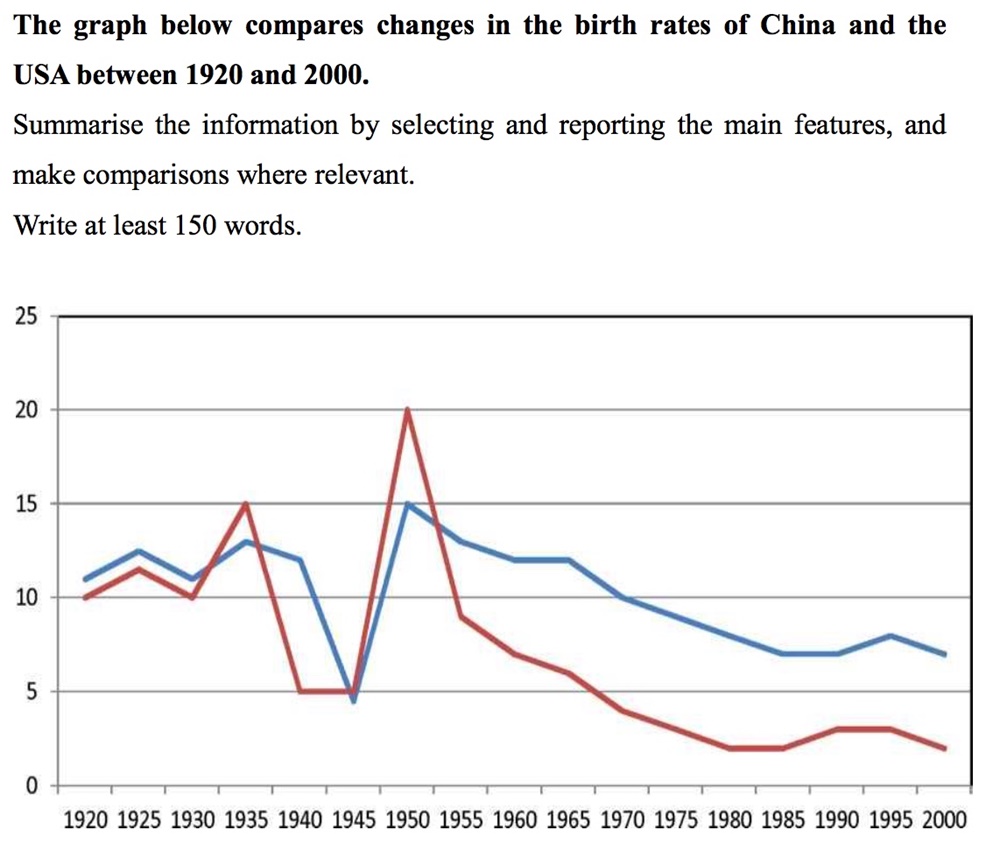
USA: blue China: red
The line graph shows the difference between the birth rates in USA and the China and how this rates changed during the 1920 - 2000 period.
Overall, the birth rates of both countries decreased over the period of 80 years. Although the two trends was similar in term of a general decline, US birth rate in most year was higher than China's one.
From 1920 to 1935, the birth rate of the USA was fluctuated, although it always remained above 10%. However, in the following 20 years, the American birth rate suddenly fell to below 5% before reversely rose to exactly 15%, which was it's highest point during the 80 - years period. Throughout the remainder of the period, there was a gradually decrease in the birth rate of the American, which dropped to approximately 7% by the year 2000.
Over the first same period, the birth rate in China varied more significantly than in the USA. Between 1935 and 1950, it sharply went down to below 5% and then grew dramatically, peaked at the highest point of the whole line chart, 20%, in 1950. By contrast, in the next 5 years, the China birth rate saw a rapid downturn, fell to 8% in 1950 and nearly 2% in 2000.
Top answer
The line graph shows the difference between the birth rates in USA and the China and how this rates changed during the 1920 - 2000 period 1920 - 2000. Overall, the birth rates of both countries decreased over the period of 80 years. Although the two trends was similar in term of a general decline, US birth rate in most year was higher than China's one .
- The line graph shows the difference between the birth rates in USA and the China and how this rates changed during the 1920 - 2000 period 1920 - 2000.
- Overall, the birth rates of both countries decreased over the period of 80 years.
- Although the two trends was similar in term of a general decline, US birth rate in most year was higher than China's one .
- From 1920 to 1935, the birth rate of the USA was fluctuated, although it always remained above 10 % .
- (the chart does not tell you that the scale is in percentage points.
Get the Weekly English Kit 📬
New words, one handy idiom, and a 2-minute quiz — delivered to your inbox to keep your streak alive.
The line graph shows the difference between the birth rates in USA and the China and how this rates changed during the 1920 - 2000 period 1920 - 2000.
Overall, the birth rates of both countries decreased over the period of 80 years. Although the two trends was similar in term of a gene
 Related Questions