
Task 1 IELTS writing - please give me some feedback
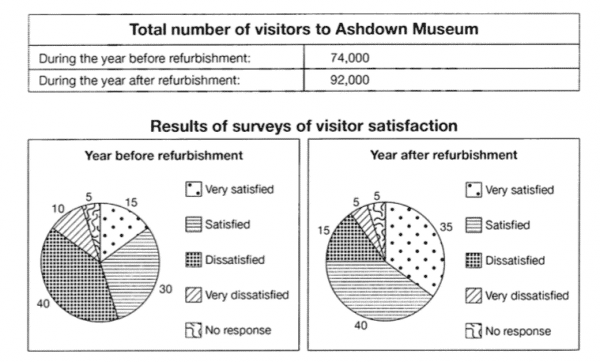
The table below shows the numbers of visitors to Ashdown Museum during the year before and the year after it was refurbished. The charts show the result of surveys asking visitors how satisfied they were with their visit, during the same two periods.
The table illustrates how many tourists visit Ashdown Museum between the year before and after its renovation while the pie charts compare the outcomes of interviews about the proportions of different extents of tourist’s satisfaction at the same periods.
It is clear that in the table, the number of visitors substantially went up after the refurbishment of the museum while in the pie charts, there was a significant rise in the proportion of people’s satisfaction.
During the year before the museum was closed to be redesigned, the total number of visitors was only 74.000 people the year after the refurbishment saw a dramatic increase in the figures for tourists which was over 90,000 people.
The year after the museum was renovated, the percentage of participants who felt content and very content both rose considerably compared to the year after the event, to more than 10%. As a result, the ratio of people voting for the dissatisfied and very dissatisfied feeling fell remarkably from 40% to 15% and from 10% to 5% respectively.
Get the Weekly English Kit 📬
New words, one handy idiom, and a 2-minute quiz — delivered to your inbox to keep your streak alive.
 Related Questions