
Task 1 IELTS writing - please give me some feedback
The chart shows the percentage of women and men in one Asian country who passed when they took their driving test between 1980 and 2010.
Summarize the information by selecting and reporting the main features, and make comparisons where relevant.
You should spend about 20 minutes on this task.
The chart illustrates the proportion of males and females who managed to acquire their driving license in an Asian nation from 1980 and 2010.
Overall, it is clear that the percentage of tests passed by females was higher than the one by males between 1980 and 2010. Besides, the proportions of tests passed by two genders were on the rise over the thirty-year period.
In 1980, the proportion of women obtaining the license after taking the driving test was just under 50% while the figure for men was just below 30%. In the next ten year, the proportion of both genders slightly rose to about 52% and 38% respectively.
Strikingly, in the year 2000, there was a considerable increase in the percentage of driving tests passed by females, at approximately 68% whereas the figures for males only went up to about 50%. However, At the end of the period, the percentage of driving exams passed by women dropped marginally to 65% whereas the figure for men remained stable.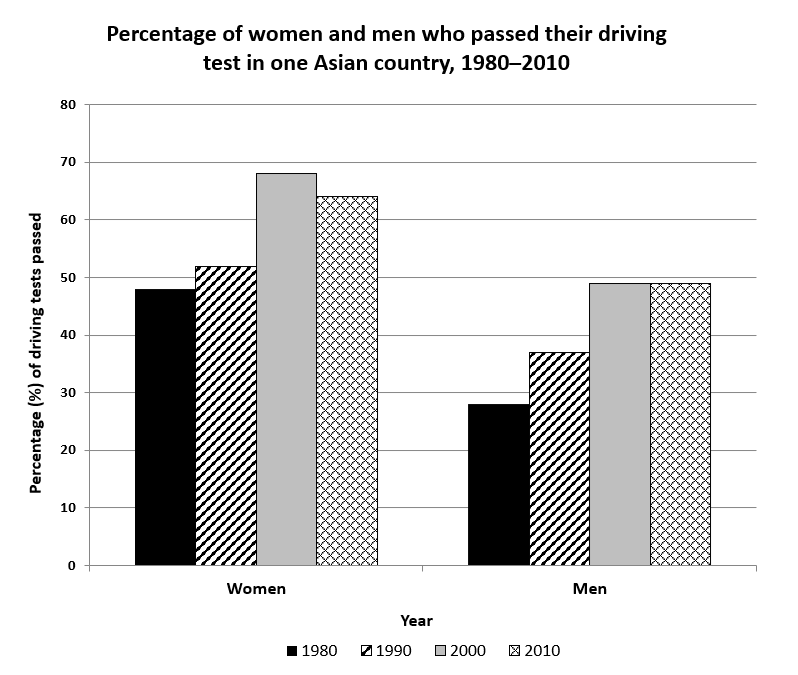
Top answer
Please read my advice for Task 1 essays: IELTS TASK 1: Hints, Tips And Advice Vocabulary Words For Task 1: Reference Post The incorrect or undesirable vocabulary usage in your essay is: illustrate "it is clear that" figure Besides these, "gender" is not used naturally. Also, this is not a line graph with continuous data. The time points are discrete.
- Please read my advice for Task 1 essays: IELTS TASK 1: Hints, Tips And Advice Vocabulary Words For Task 1: Reference Post The incorrect or undesirable vocabulary usage in your essay is: illustrate "it is clear that" figure Besides these, "gender" is not used naturally.
- Also, this is not a line graph with continuous data.
- The time points are discrete.
- Thus phrases like "thirty year period" and "stable" are inappropriate.
- If you would like a sample essay, you may ask for one.
Get the Weekly English Kit 📬
New words, one handy idiom, and a 2-minute quiz — delivered to your inbox to keep your streak alive.
Please read my advice for Task 1 essays:
IELTS TASK 1: Hints, Tips And Advice
Vocabulary Words For Task 1: Reference Post
The incorrect or undesirab
 Related Questions