
Task 1 - IELTS Writing - Line Graph - 7Th-May
The given graph shows the average amount of carbon dioxide emitted per person in four countries during the period of forty years from 1967.
It is clear that people from the United Kingdom and Sweden generally emitted less carbon dioxide, but emissions from Portugese and Italian went up during the period shown.
In 1967, the United Kingdom was the country where each person emitted nearly 11 metric tons of carbon dioxide, which was almost 11 times more than Portugese did. The figures for Sweden and Italy were over 8 metric tons and 4 metric tons respectively.
The most dramatic increase was seen in Portugal, with a rise of 500% in 2007 compared to the initial year. Italy similarly experienced growth in the emissions, which reached approximately 8 metric tonnes. While emissions fell gradually in the United Kingdom over the years, the figure for Sweden peaked in 1977 and then declined to over 5 metric tonnes in 2007, a fall of 4 metric tons with comparison to the year 1967. (169 words)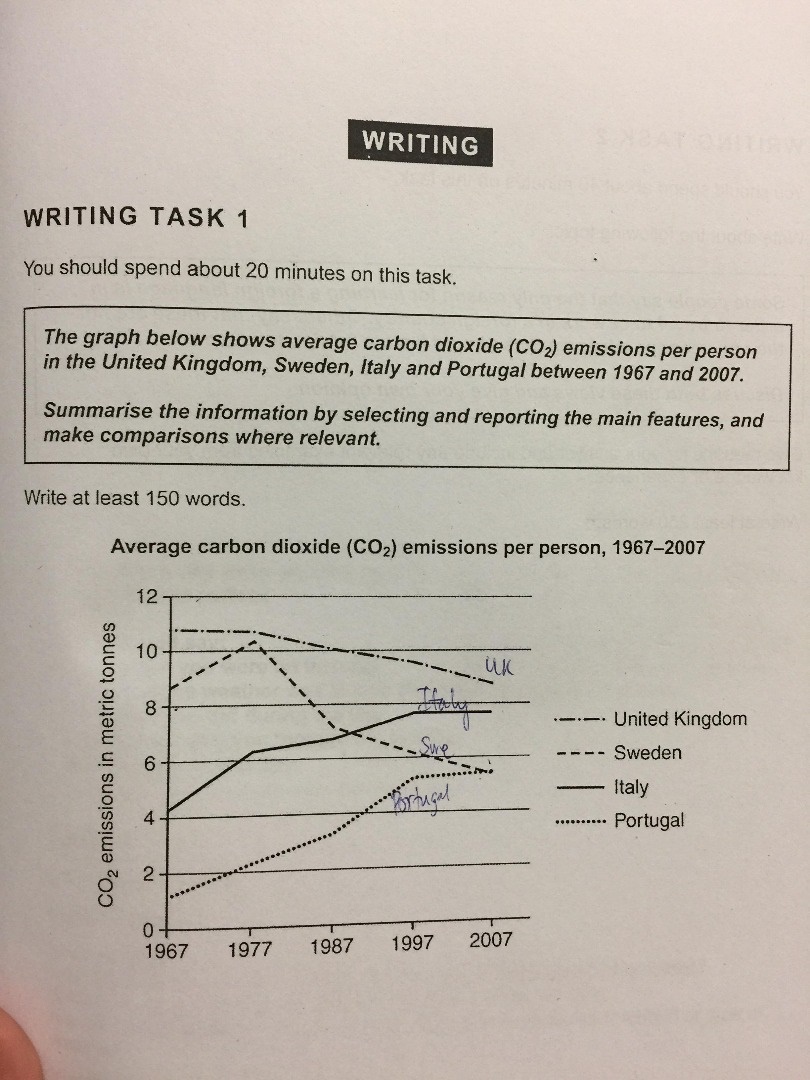
Top answer
The given graph shows the average amount of carbon dioxid e, in metric tonnes, emitted per person in four countries during the a period of forty years from starting in 1967. It is clear that [ 1] carbon emissions people from in the United Kingdom and Sweden generally went down over that period, emitted less carbon dioxide, but emissions from Portugese Portugal and Ita l y ian went u p. during the period shown.
- The given graph shows the average amount of carbon dioxid e, in metric tonnes, emitted per person in four countries during the a period of forty years from starting in 1967.
- It is clear that [ 1] carbon emissions people from in the United Kingdom and Sweden generally went down over that period, emitted less carbon dioxide, but emissions from Portugese Portugal and Ita l y ian went u p.
- during the period shown.
- In 1967, the United Kingdom was the country where each person emitted nearly 11 metric tons of carbon dioxide per person , which was almost 11 more than 10 times more than the level of Portug u ese emissions.
- did.
Get the Weekly English Kit 📬
New words, one handy idiom, and a 2-minute quiz — delivered to your inbox to keep your streak alive.
The given graph shows the average amount of carbon dioxide, in metric tonnes, emitted per person in four countries during the a period of forty years from starting in 1967.
It is clear tha
 Related Questions