
Task 1 - IELTS Writing - Line Graph
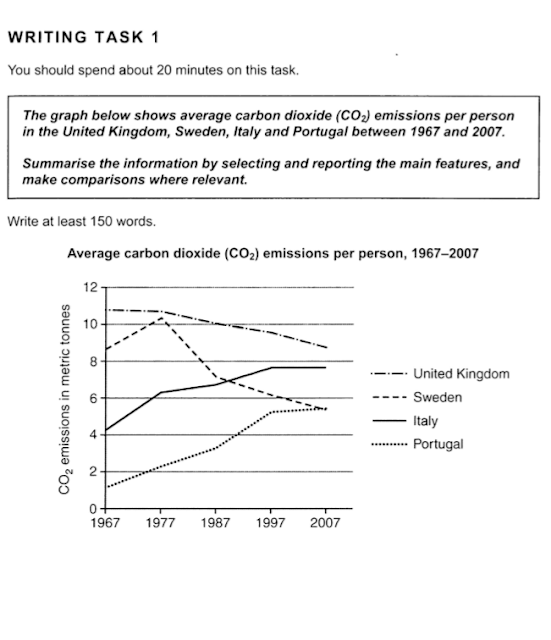
The line graph illustrates the changes in the emission of carbon dioxide in 4 different countries from 1967 to 2007.
Overall, it is clear that the production of carbon dioxide increased in Italy and Portugal, while the figure for the United Kingdom and Sweden decreased during that period.
In 1967, around 11 metric tonnes of carbon dioxide emissions was produced be the Britain, compared to about 8.7 metric tonnes of emission in Sweden and nearly 4.1 metric tonnes of emission in Italy. Just over 1.1 metric tonnes of CO2 came from Portugal.
In the period from 1967 to 2007, the production of emission in United Kingdom decreased to 8.9 metric tonnes, a fall of nearly 2 metric tonnes in 40 years. By contract, the emissions of CO2 in Italy increased to about 7.5 metric tonnes, and the figure for Portugal rose to 5.2 metric tonnes in 2007. The carbon dioxide gases in Sweden reach its highest point in 1977, at about 10.2 metric tonnes, before it fell to the same level with Portugal in 2007.
Top answer
) from 1967 to 2007. Overall, it is clear that (That is an opinion. Do not write your opinions or conclusions in Task 1.
- ) from 1967 to 2007.
- Overall, it is clear that (That is an opinion.
- Do not write your opinions or conclusions in Task 1.
- ) the production (wrong word.
- Produce means to create with intention.
Get the Weekly English Kit 📬
New words, one handy idiom, and a 2-minute quiz — delivered to your inbox to keep your streak alive.
The line graph illustrates the changes in the emission of carbon dioxide (missing words) in 4 different countries (Which countries?) from 1967 to 2007.
Overall, it is clear that (That is an opinion. Do not write your opinions or conclusions in Task 1. Also, the words have relatively little meaningful content.) the p
 Related Questions