
Task 1 IELTS writing
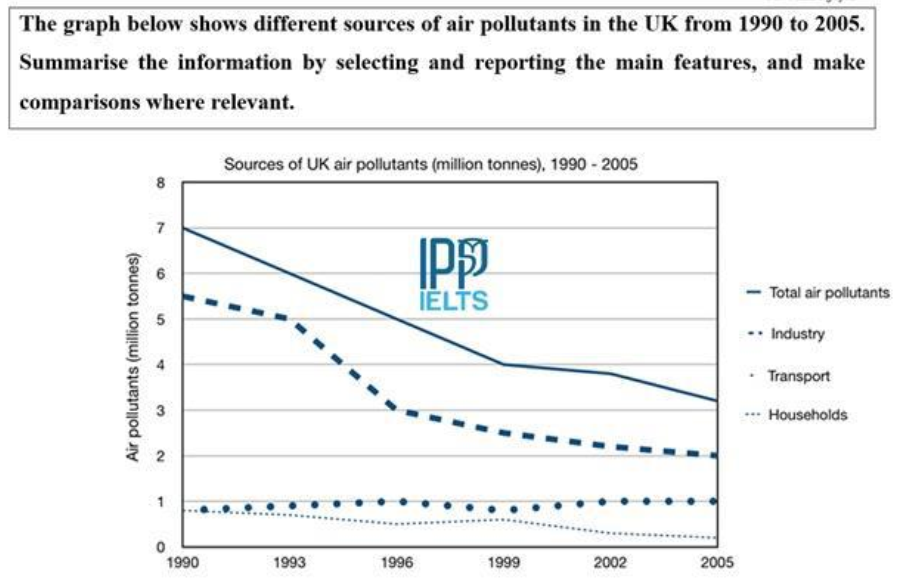
The line graph indicates the quantities of air pollutants caused by 3 elements in the UK between 1990 and 2005.
It is clear that air pollutants released by industry was by far highest than others. Additionally, there was a dramatic decrease in total air pollutants caused by all sources.
In the year 1990, industry released just over 5.5 million tonnes of air pollutants, which was approximately 6 times as high as the figure for households. At the same time, households released the same amount of air pollutants as transport, at just around 0.9 million tonnes.
During the period 1990-2005, while the figure for industry dropped significantly to 2 million tonnes of air pollutants, the amount of air pollutants caused by transport remained stable, at around 1 million tonnes. Meanwhile, the quantity of air pollutants caused by households experienced a slight decline by 0.9 million tonnes to just over 0.1 million tonnes.
Top answer
The line graph indicates the quantities of air pollutants caused (wrong word) by 3 (Use words for small numbers, except for the data values) elements (wrong word) in the UK between 1990 and 2005. (Incomplete description. ) It is clear that The amount of air pollutants released by industry was by far high er than others.
- The line graph indicates the quantities of air pollutants caused (wrong word) by 3 (Use words for small numbers, except for the data values) elements (wrong word) in the UK between 1990 and 2005.
- (Incomplete description.
- ) It is clear that The amount of air pollutants released by industry was by far high er than others.
- Additionally, there was a dramatic (How much?
- - It was cut by more than half) decrease in total air pollutants from caused by all sources.
Get the Weekly English Kit 📬
New words, one handy idiom, and a 2-minute quiz — delivered to your inbox to keep your streak alive.
The line graph indicates the quantities of air pollutants caused (wrong word) by 3 (Use words for small numbers, except for the data values) elements (wrong word) in the UK between 1990 and 2005. (Incomplete description. Mention "
 Related Questions