
Task 1 Ielts. Please check me!
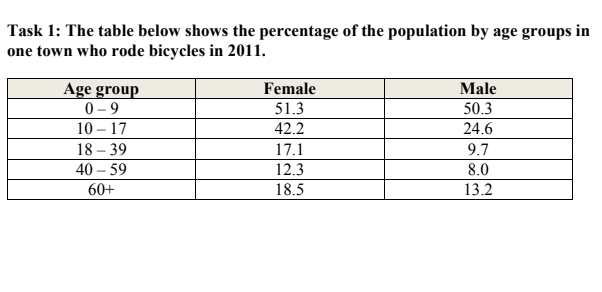
The table compares the proportion of females and males by 5 different age groups in a particular town who cycled in 2011.
Overall, it can be seen that females had a higher preference for cycling than males of all ages. Additionally, the proportion of people between 40 and 59 years old was by far the lowest cycling.
In terms of female cyclists, the people aged 0 to 9 took up 51.3% of the total population percentage in 2011, which was significantly higher than in comparison with that of 10-17 and 18-39 age groups, at 42.2% and 17.1% respectively. The proportion of cycling females falling into the 40-59 age group was lowest, at 12.3% while the figure for the elders (60 or more) went to 18.5%.
Regarding the male gender, there was a similar trend. Whereas the largest proportion for male cyclists fell into the 0-9 age group, at 50.3%, people who belong to the 40-59 were the lowest cycling percentage, at only 8%. There were 24.6%, 13.2%, and 9.7% of the total male cyclists in 10-17, 18-39, and 60 or older age groups respectively.
Top answer
The table compares the proportion of females and males by 5 five different age groups in a particular town who cycled in 2011. Overall, it can be seen that (Filler words. They say nothing about the information) females had a higher preference for cycling than males of all ages.
- The table compares the proportion of females and males by 5 five different age groups in a particular town who cycled in 2011.
- Overall, it can be seen that (Filler words.
- They say nothing about the information) females had a higher preference for cycling than males of all ages.
- Additionally, the proportion of people between 40 and 59 years old cycled the least.
- was by far the lowest cycling .
Get the Weekly English Kit 📬
New words, one handy idiom, and a 2-minute quiz — delivered to your inbox to keep your streak alive.
The table compares the proportion of females and males by 5 five different age groups in a particular town who cycled in 2011.
Overall, it can be seen that (Filler words. They say nothing about the information) females had a higher preference for cycling than males of all ages. Additionally, the proportion of
 Related Questions