
TASK 1 IELTS / BAR CHART: Please check my essay
The chart below shows the percentage change in the number of international students among university graduates in different Canadian provinces between 2001 and 2006.
Summarise the information by selecting and reporting the main features, and make comparisons where relevant.
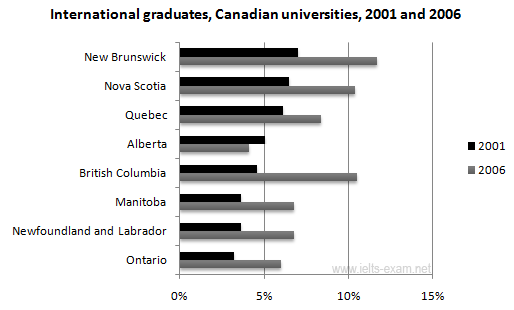
The bar chart illustrates the change in proportion of the number of foreign students graduating university in different Canadian provinces from 2001 and 2006.
Overall, almost all the provinces witnessed a rise in percentage change of international students graduates. On the contrary, in Alberta, there was a slight decline in the change in proportion.
According to the chart, the most visible changes, which were at least double the initial statistics, occured in British Columbia, Manitoba, Newfoundland and Labrador, and Ontario. In this group, the province whose percentage changed most significantly was British Columbia, from approximately 4.5% in 2001 to about 11% in 2006.
In contrast, the proportion of the number of international students graduate from universities in New Brunswick, Nova Scotia, Quebec, and Alberta experienced a much moderate change. The smallest growth appeared in Quebec, there, the percentage rose by roughly 2.5% and hit nearly 9% in 2006. Even more interesting, the statistic in Alberta fell by 1% from the initial 5%.
Top answer
The bar chart illustrates (Illustrate means "make a picture of". Use illustrate for figures that are pictures - maps, diagrams, and process flows. It is not a natural choice for plots, charts, graphs and tables.
- The bar chart illustrates (Illustrate means "make a picture of".
- Use illustrate for figures that are pictures - maps, diagrams, and process flows.
- It is not a natural choice for plots, charts, graphs and tables.
- Use one of these as appropriate: compares, gives, shows, presents, or plots.
- ) the change in the proportion of the number of foreign students graduating university in different Canadian provinces from in 2001 and 2006.
Get the Weekly English Kit 📬
New words, one handy idiom, and a 2-minute quiz — delivered to your inbox to keep your streak alive.
The bar chart illustrates (Illustrate means "make a picture of". Use illustrate for figures that are pictures - maps, diagrams, and process flows. It is not a natural choice for plots, charts, graphs and tables. Use one of these as appropriate: compares, gives, shows, presents, or plots. ) the change in the
 Related Questions