
Task 1 Essay IELTS
Hi,
Would you please check the following report?
The bar chart below shows the percentage of Australian men and women in different age groups who did regular physical activity in 2010.
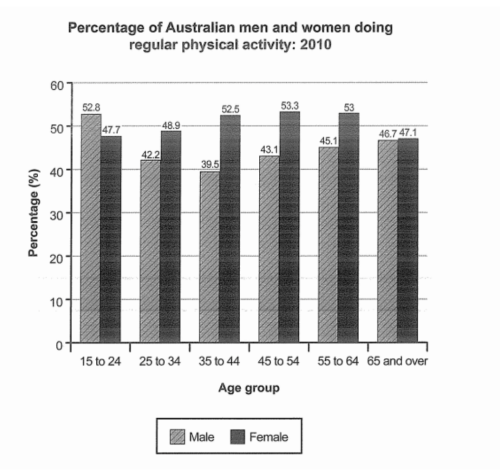
The bar graph delineates the proportion of males and females of six different age groups who performed physical activity regularly during 2010 in Australia. Overall, more women than men engaged in such activities in almost all the age groups, and unlike women, men evinced less and less interest in doing exercise until middle ages.
In the age group of 15-24, around 53% of men took physical exercise, whereas 47% of women did so. In the course of time, women out-numbered men in terms of performing physical exercise. In the age groups between 35 and 44, the figure for men decreased to 39.5%, while that of women rose to 52.5%.
The proportion of women who worked out regularly remained almost the same (around 53%) up to the age of 64, with a following return to 47% for those who were 65 and above, which was the smallest figure compared to the other age groups of this gender. Men, in contrast, grew up in number regarding doing exercise to about 47%, which was second only to the figure for teenagers and young adults aged 15 to 24.
Top answer
Note: I have answered this question earlier for another student. See the "model essay" at the bottom of this thread. htm
- Note: I have answered this question earlier for another student.
- See the "model essay" at the bottom of this thread.
- htm
Get the Weekly English Kit 📬
New words, one handy idiom, and a 2-minute quiz — delivered to your inbox to keep your streak alive.
Note:
I have answered this question earlier for another student. See the "model essay" at the bottom of this thread.
https://www.englishforums.com/English/PleaseHelpMeWritingTask1/bncxqc/post.htm
The bar graph delineates the proportion of males and females of six different age groups who performed physical activity regularly during 2010 in Australia. Overall, more women than men engaged in such activities in almost all the age groups, and unlike women, men evinced less and less interest (You have stated an opinion here. Maybe they had t
 Related Questions