
Task 1 essay for ielts: Carbon dioxide emissions per person
Greetings. This is my first post. I am practicing for ielts. Any comments are highly appreciated. Thanks in advance.
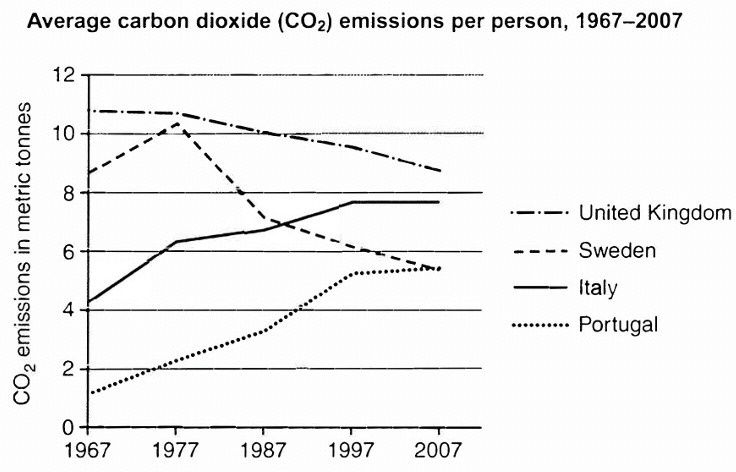
The graph below shows average carbon dioxide emissions per person in the United Kingdom, Sweden, Italy and Portugal between 1967 and 2007. Summarize the information by selecting and reporting the main features and make comparisons where relevant.
The given line graph compares carbon dioxide emissions per person in four European countries from 1967 to 2007. The emissions were measured in metric tonnes.
Overall, the graph shows that the general trend for carbon dioxide production per person declined in the UK and Sweden whereas as in Italy and Portugal it was on the rise. Additionally, the UK saw the highest amount of emissions throughout the period; however, Portugal's emissions for each person were the least in amount.
Regarding the United Kingdom, it showed a steady fall in the number, starting at around 11 in 1967 and reaching to almost 9 metric tonnes at the end. Sweden saw a decline as well, but its trajectory was not as smooth as the UK. The emissions in Sweden per person began with approximately 9 metric tonnes followed by a sharp increase to 10 units in 1977. This number, however, fell considerably by 5 metric tonnes in 2007 reaching to the lowest level among all the countries.
Moving on to Italy and Portugal, both countries showed a similar rise in the carbon dioxide emissions per person. Within the given time frame, Italy almost doubled from 4 to 8 metric tonnes while Portugal saw an increase of five folds in the figure.
Top answer
The given line graph compares carbon dioxide emissions per person in four European countries from 1967 to 2007. The emissions were measured in metric tonnes. (incomplete.
- The given line graph compares carbon dioxide emissions per person in four European countries from 1967 to 2007.
- The emissions were measured in metric tonnes.
- (incomplete.
- ) Overall, the graph shows that the general trend for carbon dioxide production per person declined in the UK and Sweden whereas as in Italy and Portugal it was on the rise.
- ) the highest amount of emissions throughout the period were in the UK and the least in ; however, Portugal.
Get the Weekly English Kit 📬
New words, one handy idiom, and a 2-minute quiz — delivered to your inbox to keep your streak alive.
The given line graph compares carbon dioxide emissions per person in four European countries from 1967 to 2007. The emissions were measured in metric tonnes. (incomplete. What are the countries?)
Overall, the graph shows that the general trend for carbon dioxide production per person declined in the UK and Sweden whereas as in Italy and Portugal it was on the rise. Addi
 Related Questions