
[ TASK 1 - BAR CHART ] Please help me fix this. Thanks !!!
The charts summarise the weight measurements of people living in Charlestown in 1955 and 2015.
Summarise the information by selecting and reporting the main features, and make comparisons where relevant.
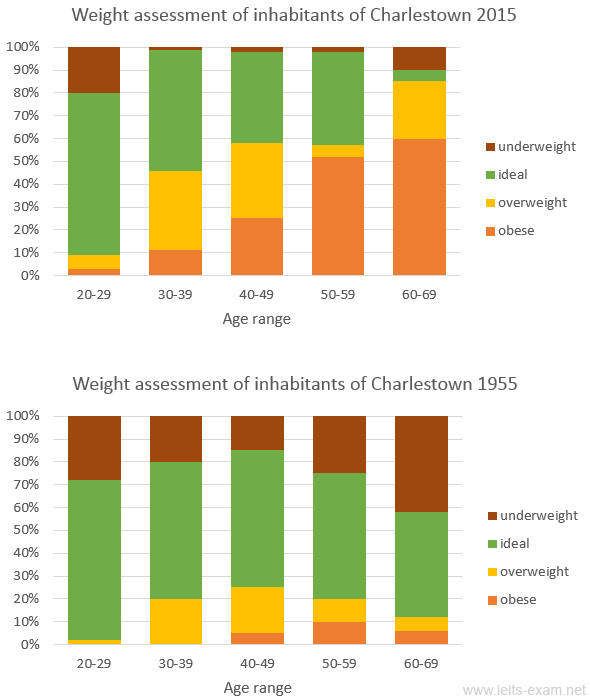
The bar charts, mentioned in percentage, illustrate the body weight of people residing in Charlestown in 1955 and 2015. As can be clearly seen, most people in 1955 had their ideal bodyweight.
In 1955, it is clearly that people were in their best shape through ages. People under 29 had the highest proportion in the ideal weight, whose data at just over 70%. Moreover, people under 39 were likely free of being obesity due to the given data, which was at 0%. In contrast, people from all ages witnessed being underweight, with the highest proportion recorded for the over-sixty-people, at a slightly over 30%.
In 2015, in contrast to 1955, there was a significant decrease of people with the ideal weight between the youngest and the oldest, whose data at about 70% and 5% respectively. Furthermore, the number of obese people rose gradually through ages and ended up at the highest percentage at just over 50% in the oldest group. In fact, the underweight problem of people from 30 to 59 were considerably minor, on average of about 2%.
Top answer
" Like pie charts, the total of all the categories shown adds up to 100% Please read my advice here: IELTS TASK 1: Hints, Tips And Advice The bar charts, mentioned (wrong word) in percentage, illustrate (wrong word) the body weight of people residing in Charlestown in 1955 and 2015. As can be clearly seen, most people in 1955 had their ideal bodyweight. (It is best to follow the essay structure as described in my advice above.
- " Like pie charts, the total of all the categories shown adds up to 100% Please read my advice here: IELTS TASK 1: Hints, Tips And Advice The bar charts, mentioned (wrong word) in percentage, illustrate (wrong word) the body weight of people residing in Charlestown in 1955 and 2015.
- As can be clearly seen, most people in 1955 had their ideal bodyweight.
- (It is best to follow the essay structure as described in my advice above.
- Paragraph 1: Describe the figures, but not the data in them.
- Paragraph 2: Write about 2 or 3 most significant observations.
Get the Weekly English Kit 📬
New words, one handy idiom, and a 2-minute quiz — delivered to your inbox to keep your streak alive.
Note: These are called "stacked bar charts." Like pie charts, the total of all the categories shown adds up to 100%
Please read my advice here: IELTS TASK 1: Hints, Tips And Advice
The bar charts, mentioned
 Related Questions