
Task 1 - Bar chart
Could you please check my essay? Thanks a lot!
The charts below show the levels of participation in education and science in developing and industrialized countries in 1980 and 1990.
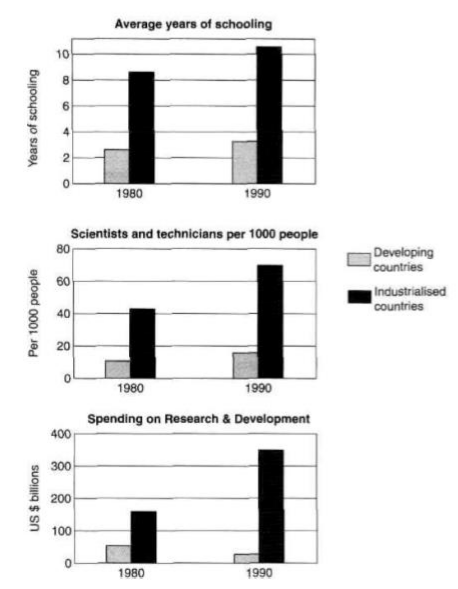
The three bar charts illustrate the change in the average years of schooling, the rate of scientists and technicians and the spending on research and development in developing countries and industrialised countries in 1980 and 1990.
Overall, both developing and industrialised countries experienced the significant leap in participation in education and science from 1980 to 1990. In particular, most figures of industrialised countries much higher than these of developing countries.
The average years of schooling in developed countries were over 8 years in 1980 and over 10 years in 1990, which were nearly four times more than these rates in developing countries with only just over 2% and over 3%, respectively. The number of scientists and technicians per 1000 people in developed nations was over 40 people in 1980, then jumping dramatically to nearly 70 people in 1990. Meanwhile, the rate of scientists and technicians in developing coiuntries witnessed a slight rise from 10 per 1000 people to 17 in 1990.
Industrial countries took over developing countries in the amount of money spending on research and development with over 150 billion dollars in 1980 and 350 billion dollars in 1990, compared to modest figures around just under 50 billion dollars in developing countries. While expenditures on research and development in industrialised countries rocketed spectacularly during 10 years, there was a downward trend in the budget of developing countries for this field from appropriately 50 billion dollars in 1980 to under 25 billions in 1990.
Top answer
The three bar charts illustrate the differences between developing countries and industrialised countries in 1980 and 1990 according to three factors: first, the change in the average years of schooling, second, the rate (prevalence ) of scientists and technicians (in the population) and third, the spending on research and development in developing countries and industrialised countries in 1980 and 1990 . Overall, both developing and industrialised countries experienced the (wrong determiner) significant leap in participation in education and science from 1980 to 1990 (That is not true. The spending on science actually decreased in the developing countries.
- The three bar charts illustrate the differences between developing countries and industrialised countries in 1980 and 1990 according to three factors: first, the change in the average years of schooling, second, the rate (prevalence ) of scientists and technicians (in the population) and third, the spending on research and development in developing countries and industrialised countries in 1980 and 1990 .
- Overall, both developing and industrialised countries experienced the (wrong determiner) significant leap in participation in education and science from 1980 to 1990 (That is not true.
- The spending on science actually decreased in the developing countries.
- ") .
- ) of developing countries.
Get the Weekly English Kit 📬
New words, one handy idiom, and a 2-minute quiz — delivered to your inbox to keep your streak alive.
The three bar charts illustrate the differences between developing countries and industrialised countries in 1980 and 1990 according to three factors: first, the change in the average years of schooling, second, the rate (prevalence ) of scientists and technicians (in the population) and third, the spending on research an
 Related Questions