
Task 1
The first bar chart provides information about the major reason for study amongst the students of different age range and the second chart shows the proportion of help and time off that employers give to the students.
Overall, the number of students who have to study in order to work decrease by growing older ,by contrast the number of the students who just study as a hobby increase by growing older ,on the other hand the supports given to them is varied in different age groups.
As it can be observed from the bar chart under 26-year-old people have less desire to choose studying as only an interest with the percentage of 80% , while older people with the age of over 49-year-old are more keen on studying as an interest (70%). It also can be seen that the number of students with the age of 40-49 who wants to study as an interest are equal to the people who wants to study to work.
It can be seen that people under 26-year-old get more support and time off from their employers with the percentage of almost 60% and the people with the age of over 49-year-old with the percentage of around 40% have the second place in receiving help and support ,whereas the least amount of support is given to the students with the age of 30 to 39 (approximately 30%)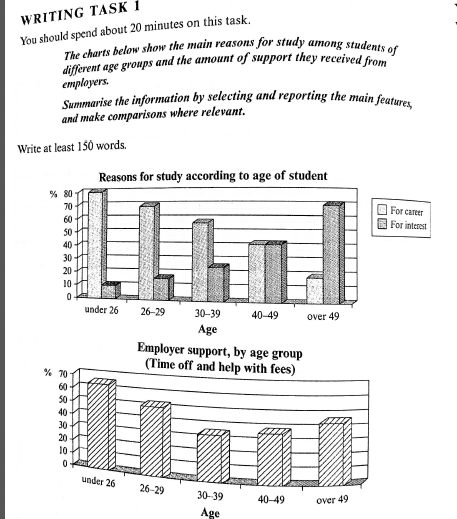
Top answer
The first bar chart provides information about (That is very vague and imprecise. ) the major reason for study amongst the students of different age range (Wrong form, and also leaves the question - How many? ) and the second chart shows the proportion of help (incorrect.
- The first bar chart provides information about (That is very vague and imprecise.
- ) the major reason for study amongst the students of different age range (Wrong form, and also leaves the question - How many?
- ) and the second chart shows the proportion of help (incorrect.
- ) and time off that employers give to the students.
- (The opening paragraph leaves a lot to be desired.
Get the Weekly English Kit 📬
New words, one handy idiom, and a 2-minute quiz — delivered to your inbox to keep your streak alive.
The first bar chart provides information about (That is very vague and imprecise. What exactly is plotted here?) the major reason for study amongst the students of different age range (Wrong form, and also leaves the question - How many? What are they?) and the second chart shows the
 Related Questions