
TASK 1
I am going to take IELTS examination so I really need your help. Please give your comment on my answer. Many thanks!
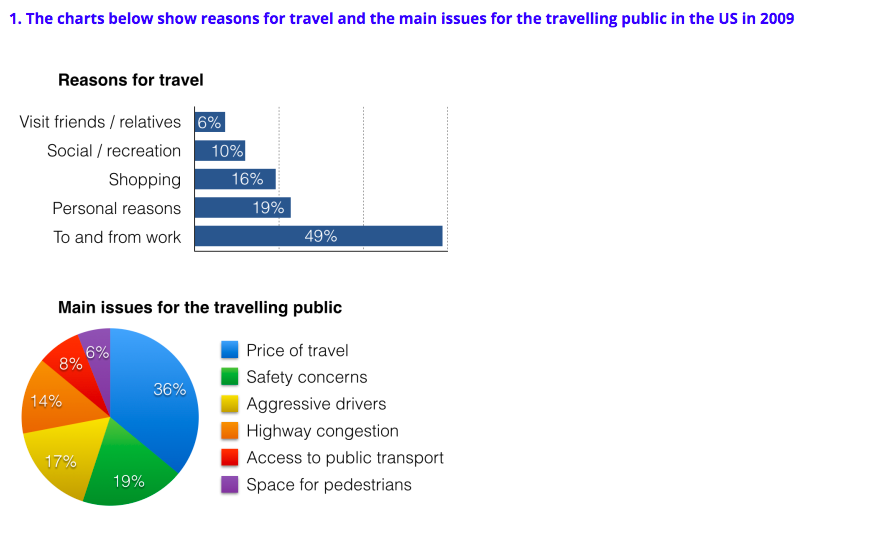
The two chart give information about US main travelling issues in the year 2009. The bar chart presents causes for travelling and the pie chart gives information about primary problems when Americans travelled.
Overall, the principal reason why people travel in US in 2009 was to commute to and from work. In the same year, Americans concerned most about travelling cost among six dimensions.
Looking at the information in more detail, nearly half of the trips were made by Americans to commute to and from work, whereas trips made for social and entertaining reasons accounted for just 10 percent. Remarkably, travelling to pay a visit to acquaintances like friends and relatives made up 6 percent which was the less popular cause of making trips in US.
Regarding the pie chart, cost of travelling was considered most with 36 percent of American travellers, which have sixfold concerns in terms of pedestrians’ areas. Almost one in five people mentioned safety as travel concerns in the public. Finally, highway congestion and aggressive drivers was cited for 14% and 17% respectively.
Get the Weekly English Kit 📬
New words, one handy idiom, and a 2-minute quiz — delivered to your inbox to keep your streak alive.
 Related Questions