
T1 essay
Hi,
I would appreciate it if you could check the following.
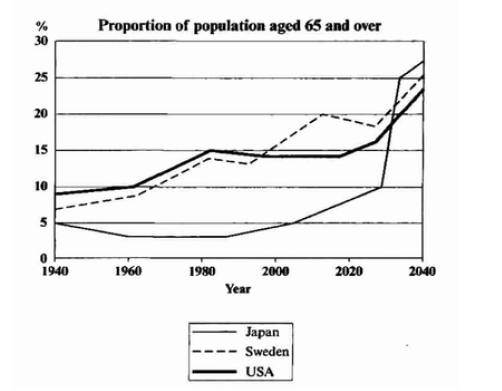
The graph above shows the proportion of the population aged 65 and over between 1940 and 2040 in three different countries.

The assumption is that we are in the year 2050 now.
The presented diagram delineates how the population of people aged 65 and above changed over a period of one century in three separate nations: The USA, Sweden, and Japan. Overall, while all the nations at issue generally followed an upward trend over the survey, the figures for USA and Sweden were very close to each other compared to that of Japan.
In 1940, 5% of people in Japan were 65 and older. This percentage did not rise until 2005, when it started to go up sharply, experiencing a twofold increase by the end of the 2020's. In 2030, it surged dramatically exceeding 25% in less than 10 years, followed by a less significant growth to the end of the period.
Another look at the graph reveals that both the United States and Sweden started the period (in 1940) with values below 10%. By the same token, they achieved a steady growth, reaching 15% in 1990. While the percentage of the senior citizens in the United States of America plateaued out remaining at the same level until 2015, that of Sweden outstripped it, accounting for one fifth of the total population in 2010, though it subsequently suffered a minor setback for the next 15 years. Finally, both the proportion of the age-group at question in these nations climbed swiftly to around 25% at the end of the survey in 2040.
Top answer
Okay, here are my suggestions. (I assume your essay begins here): The presented diagram delineates how the population of people aged 65 and above changed over a period of one century in three separate nations: The USA, Sweden, and Japan. Overall, while this group all the nations at issue generally followed an upward trend in all three nations over the period in question survey , the figures for USA and Sweden were very close to each other compared to that of Japan.
- Okay, here are my suggestions.
- (I assume your essay begins here): The presented diagram delineates how the population of people aged 65 and above changed over a period of one century in three separate nations: The USA, Sweden, and Japan.
- Overall, while this group all the nations at issue generally followed an upward trend in all three nations over the period in question survey , the figures for USA and Sweden were very close to each other compared to that of Japan.
- In 1940, only 5% of people in Japan were 65 and older.
- This percentage did not rise until 2005, when it started to go up sharply, experiencing a twofold increase by the end of the 2020's.
Get the Weekly English Kit 📬
New words, one handy idiom, and a 2-minute quiz — delivered to your inbox to keep your streak alive.
Okay, here are my suggestions. (I assume your essay begins here):
The presented diagram delineates how the population of people aged 65 and above changed over a period of one century in three separate nations: The USA, Sweden, and Japan. Overall, while this group all the nations at issue generally followed an upward trend in all three nations over the
Task 1 is an extreme challenge for a student learning English. It takes a lot of practice and vocabulary to write a superlative task 1 essay. I consider task 1 much more difficult than task 2.
The student must write a precise and accurate description of the figure or figures, and not give opinions or conclusions. The skill level expected is for writing accepted by a professor in a univ
 Related Questions