
Subject: Please review my IELTS essay, writing task 1, cambridge 10
My essay:
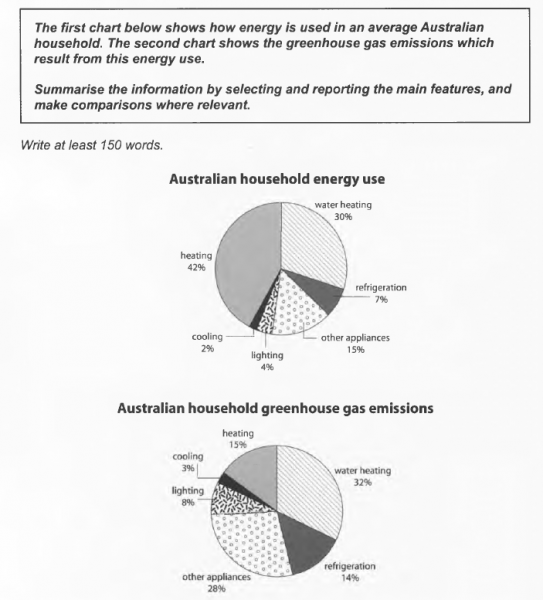
The two given pie charts give information about the energy consumption in categories and the corresponding released greenhouse gas emissions from a typical Australian family.
Overall, the first pie chart shows the top energy usage is heating. However, the latter pie chart illustrates the main sources of greenhouse gas are from water heating and other appliances.
42% of energy use, which accounts for the largest part is for heating while its released greenhouse gas emissions percentage is not significant, only 15%. In contrast, the energy which is spent on other appliances is just 15% leading to a big amount of greenhouse gas, 28%. Water heating accounts for about one-third of energy usage, at 30% releasing a similar proportion of emissions, 32%.
Australian spend the least energy on cooling, at 2% and the corresponding greenhouse emissions cover a similar percentage, at 3%. Only 7% of energy is used for refrigeration whilst the greenhouse gas produced from it is double, 14%. Likewise, 4% energy consumption for lighting causing 8% of greenhouse emissions.
Top answer
The requirements of the task (to summarize and make comparisons) have been addressed, and information appropriately selected. The overview presents two notable points of interest and differences. There is progression in the way the report is presented, going from the general toward more detail, an a clear attempt to arrange the detail in some comprehensible order.
- The requirements of the task (to summarize and make comparisons) have been addressed, and information appropriately selected.
- The overview presents two notable points of interest and differences.
- There is progression in the way the report is presented, going from the general toward more detail, an a clear attempt to arrange the detail in some comprehensible order.
- Various cohesive devices are used to effect.
- The two given [ 'given' comes after the noun ] pie charts give [' provide information' is more common and more formal ] information about the energy consumption in categories [ either list the categories here or elsewhere in the introduction, or at least state how many there are ] and [ Why not start a new sentence instead?
Get the Weekly English Kit 📬
New words, one handy idiom, and a 2-minute quiz — delivered to your inbox to keep your streak alive.
The requirements of the task (to summarize and make comparisons) have been addressed, and information appropriately selected. The overview presents two notable points of interest and differences.
There is progression in the way the report is presented, going from the general toward more detail, an a clear attempt to arrange the detail in some comprehensible order. Various cohe
 Related Questions