
Someone marks me pls task 1 writing
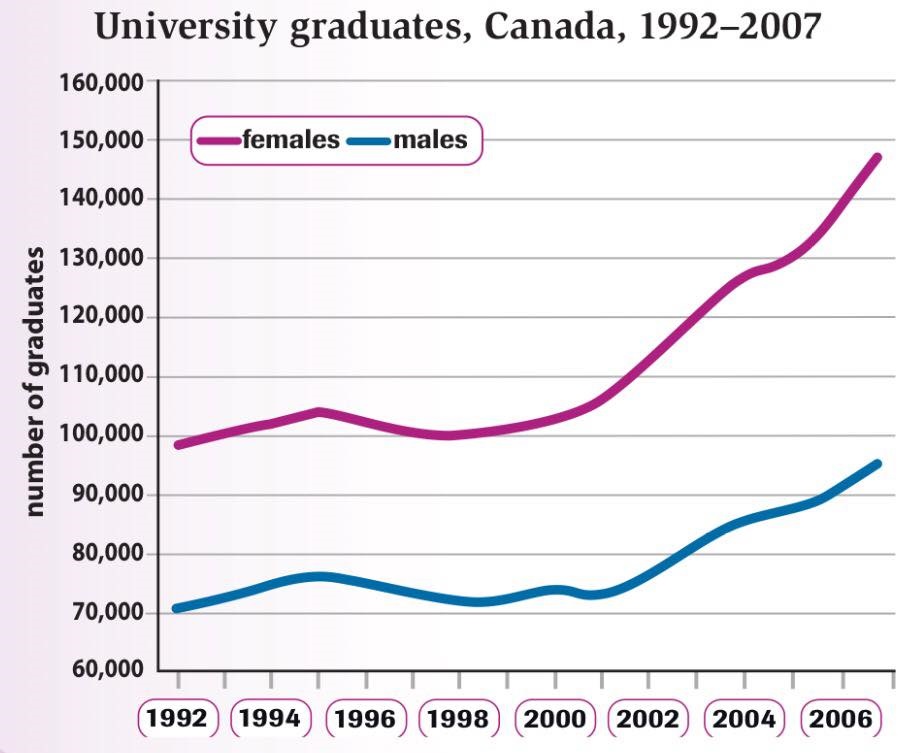
The graph below shows the number of university graduates in Canada from 1992 to 2007.
Summarise the information by selecting and reporting the main features and make comparisons where relevant.
essay goes here:
The line graph illustrates the number of graduate students from colleges between 1992 and 2007 in Canada
Overall, it can be seen that both two genders which are males and females witnessed upward trends in the number of postgraduates in a period of time which is from 1992 to 2006
There was a slight upward from 100,000 to approximately 105,000 female graduates in 1992 to 1996, followed by a small drop from 105,000 to exact 100,000 between 1996 and 1998. However, females who attended universities rose dramatically from 100,000 all the way up to roughly 149,000 from 1998 to the end of the period.
The number of the opposite sex students increased steadily from 70 thousand to about 77 thousand from 1992 to 1994. Then, there was a fluctuate from 77 thousand to 72 thousand postgraduates between 1994 to 2000, followed by a sharp climb from 72,000 to approximately 97,000 who were college graduates from 2000 to 2006.
Top answer
Please read my advice for Task 1 essays: IELTS TASK 1: Hints, Tips And Advice Vocabulary Words For Task 1: Reference Post
- Please read my advice for Task 1 essays: IELTS TASK 1: Hints, Tips And Advice Vocabulary Words For Task 1: Reference Post
Get the Weekly English Kit 📬
New words, one handy idiom, and a 2-minute quiz — delivered to your inbox to keep your streak alive.
Please read my advice for Task 1 essays:
The line graph illustrates (wrong verb. Read my advice.) the number of graduate students from colleges between 1992 and 2007 in Canada
Overall, it can be seen that (Unnecessary verbiage. Read my advice) both two (You cannot use these tow words together. Both mean
 Related Questions