
Review ielts writing task 1
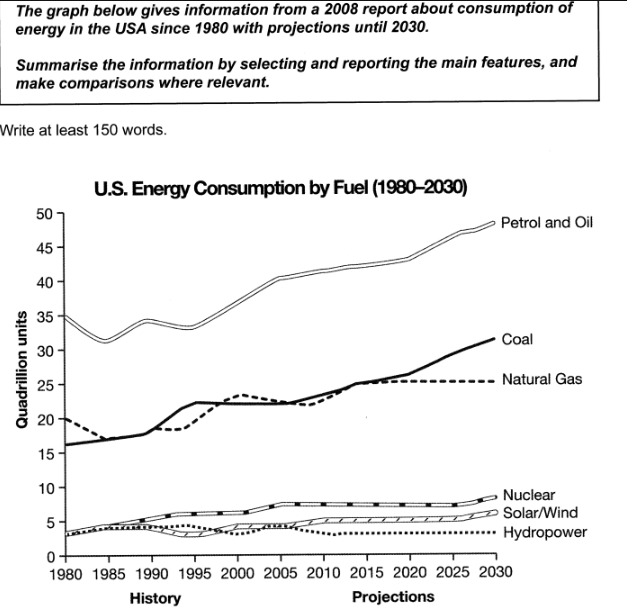
The provided line graph represents the use of six different energies in the USA from 1980 to 2030 (forecast). Unit is measured in quadrillion.
A glance at the graph reveals that during a half century, 5 out of 6 energy sources keep increasing except Hydropower. Petrol and Oil has been consumed the most and is expected to still be the most-used fuel in the future.
In 1980, the greatest amount of fuel used for energy-generating went for Petrol and Oil, at about 35 quadrillion. Natural gas and Coal came in second and third, at 20 and around 16 respectively. Three other eco-friendly energy sources (Nuclear, Solar/Wind and Hydropower) just stood at approximately 4.
Over a time span of 50 years, consumption of Petrol and Oil is estimated to rocket sharply and finally reach 50 quadrillion in 2030. In the interim, the use of Coal is expected to nearly double and eventually surpass Natural gas, at more or less 30 and 20 respectively. In 2030, Nuclear and Solar/Wind energy is projected to mildly climb up, whilst, Hydropower is forecasted to remain static as compared to the amount in 1980.
Top answer
The provided (Unnatural. Do not use these past participles. ) line graph represents the use of six different energies ( wrong expression, Unnatural) in the USA from 1980 to 2030 (forecast) .
- The provided (Unnatural.
- Do not use these past participles.
- ) line graph represents the use of six different energies ( wrong expression, Unnatural) in the USA from 1980 to 2030 (forecast) .
- Unit is measured ( wrong expression, We do not measure units.
- We measure time, lengths, amounts, quantities, and proportions.
Get the Weekly English Kit 📬
New words, one handy idiom, and a 2-minute quiz — delivered to your inbox to keep your streak alive.
The provided (Unnatural. Do not use these past participles. ) line graph represents the use of six different energies ( wrong expression, Unnatural) in the USA from 1980 to 2030 (forecast). Unit is measured ( wrong expression,
The first thing to do on the graphs that cover past and future is to determine what years are "past" and what years are "future."
You need to use past tense verbs for the past years and present or future tense for the "future" years.
In this topic, any data points after 2008 are "future" and all the others are past. Why is that? Because the research project that made
 Related Questions