
[Repost] [Task_1] Practice task in Improve your writing skills book
Hi guys, My name is Galvin. I am taking writing practice in preparation for my upcoming Ielts examination. I take this practice test from the "Improve your writing skills" of Macmillan.
Task 1: The graph shows the income of four cafe in New York over last year. Summerise the information by selecting and reporting the main features. Make comparisons where it is relevant.
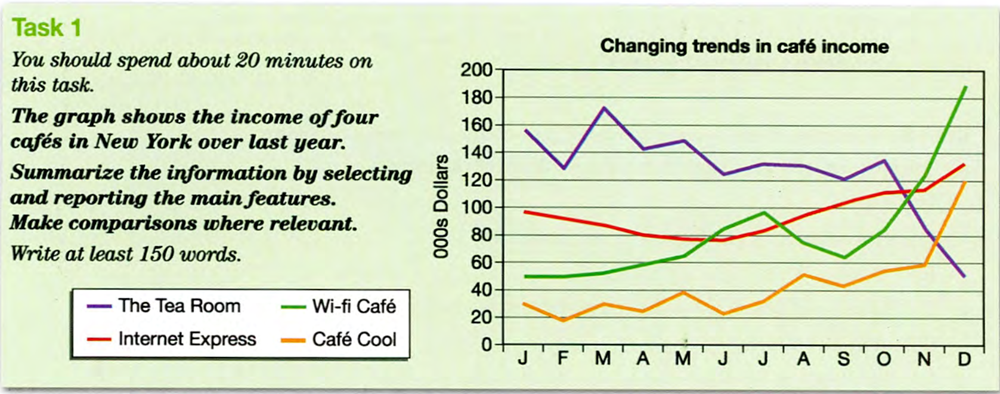
The line graph illustrates information regarding the earnings of four New York-based cafe, namely the The Tea Room, Wifi Cafe, Internet Express, and Cafe Cool over the last year.
Looking at the graph, albeit the income of the four cafe experienced some fluctuation from month to month, it is noticeable that the 1-year sales of The Tea Room demonstrated a drop while that of the other three cafe was on the rise. Particularly, The Tea Room's earnings slightly decreased from around 160.000 dollars in January to almost 140.000 dollars in October, then plummeted to approximately 50.000 dollars in December. Compared to the other three cafes, this sale of The Tea Room was the lowest by the end of the year.
By contrast, the income of other three cafe-specialised avenues in New York went up by varying degrees. To be more specific, there was a gradual increase in relation to the Cafe Cool's earnings over the first ten months, followed by a sudden rise to 120.000 dollars in December. In addition, the Wifi Cafe and Internet Express also experienced an upward trend. Between January to June, the former doubled its earnings from 50.000 dollars to nearly 100.000 dollars, then reached its peak at relatively 190.000 dollars. Likewise, the trend for the Internet Express was also upward. There was a steady fall for the Internet Express in terms of earnings, however, it gradually climbed up, ending the year at at relatively 130.000 dollars.
Top answer
Crokcodi The line graph illustrates information Illustrate is not an appropriate verb for plots or tables of data. Use it for maps, flowcharts, and diagrams. Those figures are pictures.
- Crokcodi The line graph illustrates information Illustrate is not an appropriate verb for plots or tables of data.
- Use it for maps, flowcharts, and diagrams.
- Those figures are pictures.
- "Illustrate" means "show a picture of" or visualize something.
- For plots you can use compare, plot, give, show and sometimes depict.
Get the Weekly English Kit 📬
New words, one handy idiom, and a 2-minute quiz — delivered to your inbox to keep your streak alive.
CrokcodiThe line graph illustrates information
Illustrate is not an appropriate verb for plots or tables of data.
Use it for maps, flowcharts, and diagrams. Those figures are pictures. "Illustrate" means "show a picture of" or visualize somethin
The line graph illustrates information regarding the earnings of four New York-based cafe, (wrong form) namely the The Tea Room, Wifi Cafe, Internet Express, and Cafe Cool over the last year.
Your essay outline is not good. Read my advice:
 Related Questions