
[Practice_Test_2] Writing_Task 1_Line graph
Hi guys, It is me again, Galvin. This is the second piece of writing practice I took this week. Could you kindly comment on this. Much appreciated.
Topic:
You should spend about 20 minutes on this task.
The lgraph shows the percentage of 15 year olds with low literacy (reading and writing) levels in four countries. Summarize the information by selecting and reporting the main features, and make comparisons where relevant.
Write at least 150 words.
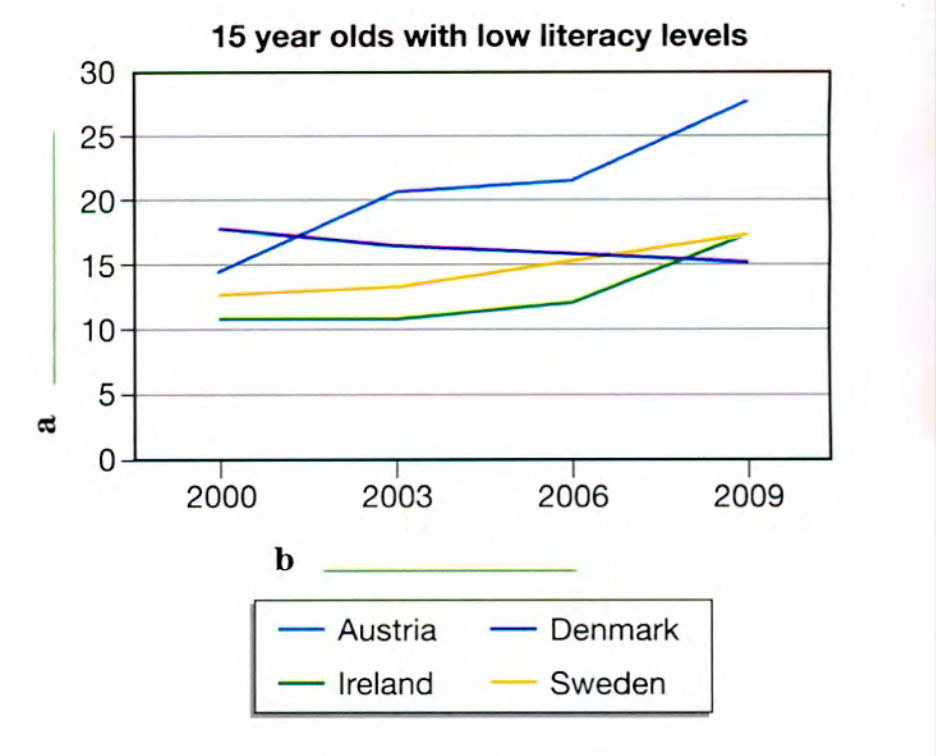
The graph line compares the reading and writing competency of children aged 15 among four countries, namely Australia, Denmark, Ireland, and Sweden, over a period of 9 years.
Overall, only Denmark represented a downward trend while the other three countries were on the rise. Moreover, throughout the period, Australian teenagers at the age of 15 registered the highest position regarding levels of literacy compared to other figures shown on the chart.
Indeed, in 2002, Denmark stood at under 20 percent in the number of 15 years old with literacy issues. This figure decreased gradually over time and ended the period at roughly 15 percent.
Conversely, there was a significant increase in the poor proficiency rate of literacy skills in Australia, which almost doubled from around 15 percent in 2000 to 28 percent. The total percentage of this literacy levels in Sweden likewise was approximately 2 percent higher when it was originally documented in 2000. A slight rise was seen in Ireland, which climbed to 15 percent after remaining quite stable from 2000 to 2006.
Drop here!Top answer
The graph line (Incorrect) compares the r eading and writing competency (That is not what is plotted) of children aged 15 among in four countries, namely Australia, Denmark, Ireland, and Sweden, over a period of 9 years. (1954-1963 is 9 years, and so is 1919-1928, and so is 2010-2019. ) Overall, only Denmark represented (wrong word) a downward trend while the other three countries were on the rise.
- The graph line (Incorrect) compares the r eading and writing competency (That is not what is plotted) of children aged 15 among in four countries, namely Australia, Denmark, Ireland, and Sweden, over a period of 9 years.
- (1954-1963 is 9 years, and so is 1919-1928, and so is 2010-2019.
- ) Overall, only Denmark represented (wrong word) a downward trend while the other three countries were on the rise.
- Moreover, throughout the period, Australian teenagers at the age of 15 (poor expression) registered (not a good word choice) the highest position regarding levels of literac y (You have it backwards) compared to other figures (Wrong word.
- Read my advice.
Get the Weekly English Kit 📬
New words, one handy idiom, and a 2-minute quiz — delivered to your inbox to keep your streak alive.
The graph line (Incorrect) compares the reading and writing competency (That is not what is plotted) of children aged 15 among in four countries, namely Australia, Denmark, Ireland, and Sweden,
 Related Questions