
Practice of describing a graph
This practice is a requirement form the picture below
MY ANSWER:
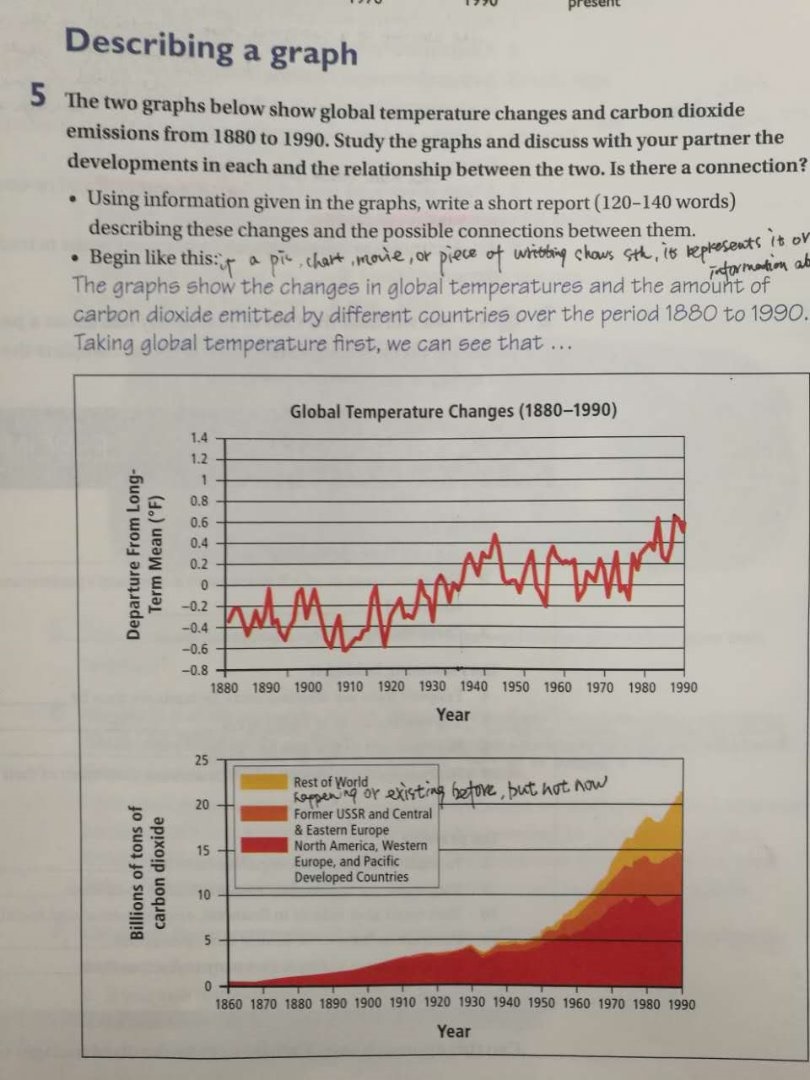
The graphs show that how the globle temperature and the amount of emissions of carbon dioxide had changed over the past period of 1880 to 1990.
Taking the first graph first, we can see that the trend of global temperature changes fluctuated quiet frequently. Then in 1930s it seems to there was a turning point: before this period the global temperature rarely went up, in other words the global temperature decreased unpredictably; during this period of time and after, the globle temperature started growing and reached a high point of more than 0.6 degrees in about the year of 1988. Though it decreased in some years, on the whole it increased in general over the period 1930 to 1990.
Now let's look at the second graph, it depicts the trend of carbon dioxide emissions from 1860 to 1950. It is obviously that the carbon dioxide emission went up gradually. However, after 1950 it is grew sharply. and not only did the area of the rest of world exceeded other part of the world, but it also seems the emissions is out of control. Former USSR and Central & Easter Europe took the second position to this contribution. And North Amerca, Western Europe,and Pacific Developed Countries are the third responsible for the carbon dioxide emission.
From information of the two graphs, there is perhaps a connection between globle temperature changes and the amount of carbon dioxide emissions in general trend, because after the amount of carbon dioxide emissions went up sharply, the globle temperature had a rise in general.
Top answer
he graphs show that how the globle temperature and the amount of emissions of carbon dioxide had changed over the past period of 1880 to 1990. Taking the first graph first , (you did not follow the instructions. ") we can see that the trend (incorrect vocabulary usage.
- he graphs show that how the globle temperature and the amount of emissions of carbon dioxide had changed over the past period of 1880 to 1990.
- Taking the first graph first , (you did not follow the instructions.
- ") we can see that the trend (incorrect vocabulary usage.
- A trend, by definition, smooths out the short-term fluctuations) of global temperature changes fluctuated quiet frequently.
- ) in about the year of 1988.
Get the Weekly English Kit 📬
New words, one handy idiom, and a 2-minute quiz — delivered to your inbox to keep your streak alive.
he graphs show that how the globle temperature and the amount of emissions of carbon dioxide had changed over the past period of 1880 to 1990.
Taking the first graph first, (you did not follow the instructions. The reader might not know what you mean by the "first graph.") we can see that the t
 Related Questions