
Practice essay T1 ielts-proof need
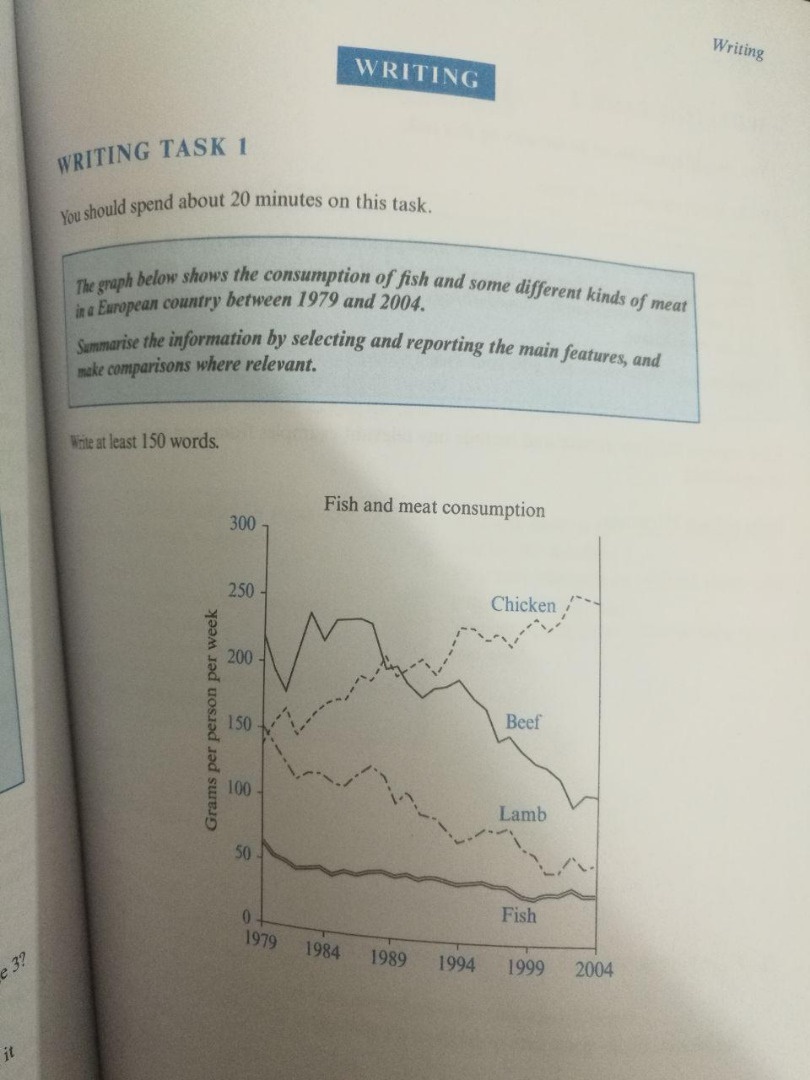
The line graph shows the amount of four different types of meat consumed by the people of a European country over a 25-year period: 1979-2004. The figures are in terms of grams per person per week.
Overall, beef, lamb, and fish had a downward trend over the period, while chicken had an upward one and finished the survey well above the other items.
In 1979, almost the same amounts of lamb and chicken were consumed (150 grams). In the same year, beef- with around 220 grams per week- was the most popular type of meet, whereas fish was the least consumed type of meat with just 60 grams.
A closer look at the chart reveals that beef had a erratic change until 1989, when it was outstripped by chicken at around 200 grams. While the former fell significantly to around 100 in 2004, the latter kept its upward trend to finish the period at just over 250 grams.
The rest of the chart shows that lamb had a steady decrease and finished the period of about the same consumption rate which fish had in 1979 (60 grams). Finally, it is evident that people had almost a constant consumption of fish over the whole period.
Thanks in advance.
Top answer
Hello. I answered this yesterday, but there was a posting problem. So here is what I suggested: The line graph shows the amount of four different types of meat consumed by the people of an unnamed European country over a 25-year period: 1979-2004.
- Hello.
- I answered this yesterday, but there was a posting problem.
- So here is what I suggested: The line graph shows the amount of four different types of meat consumed by the people of an unnamed European country over a 25-year period: 1979-2004.
- The figures are in terms of grams per person per week.
- Overall, consumption of beef, lamb, and fish had showed/followed a downward trend over the period, while consumption of chicken showed/followed had an upward one trend and finished the survey well above the other items.
Get the Weekly English Kit 📬
New words, one handy idiom, and a 2-minute quiz — delivered to your inbox to keep your streak alive.
Hello. I answered this yesterday, but there was a posting problem. So here is what I suggested:
The line graph shows the amount of four different types of meat consumed by the people of an unnamed European country over a 25-year period: 1979-2004. The figures are in terms of grams per person per week.
Overall, consumption of beef, lamb, and fish had
 Related Questions