
Pls review my Ielts writing task 1 essay
The bar charts below show the percentages of men and women in employment in three countries in 2005 and 2015.
Summarise the information by selecting and reporting the main features, and make comparisons where relevant.
The two bar charts give data about how many males and females engaged in employment in three countries: Canada, South Korea, and Sweden in 2005 and 2015.
Overall, there was an increase in the number of male and female workers in Canada and South Korea from 2005 to 2015, while there was a decrease in the number of their counterparts in Sweden. Employment rates in Sweden was the highest in 2005, but slipped to be the lowest in 2015, except for the category is male workers)
In 2005, the number of males in employments in Sweden started at around 79% then decreased to exactly 70%, whereas their female counterparts took up more employments (from 46% in 2005 to 50% in 2015). Opposite changes can be seen in the employment trend of workers in Canada. Males in employments rose from 63% to 39%, and females in employment climbed from 39% to 55%.
Approximately 75% and 30% South Korean male and female employees were working in 2005, followed by a slight increase to 79% and 39% in 2015, respectively.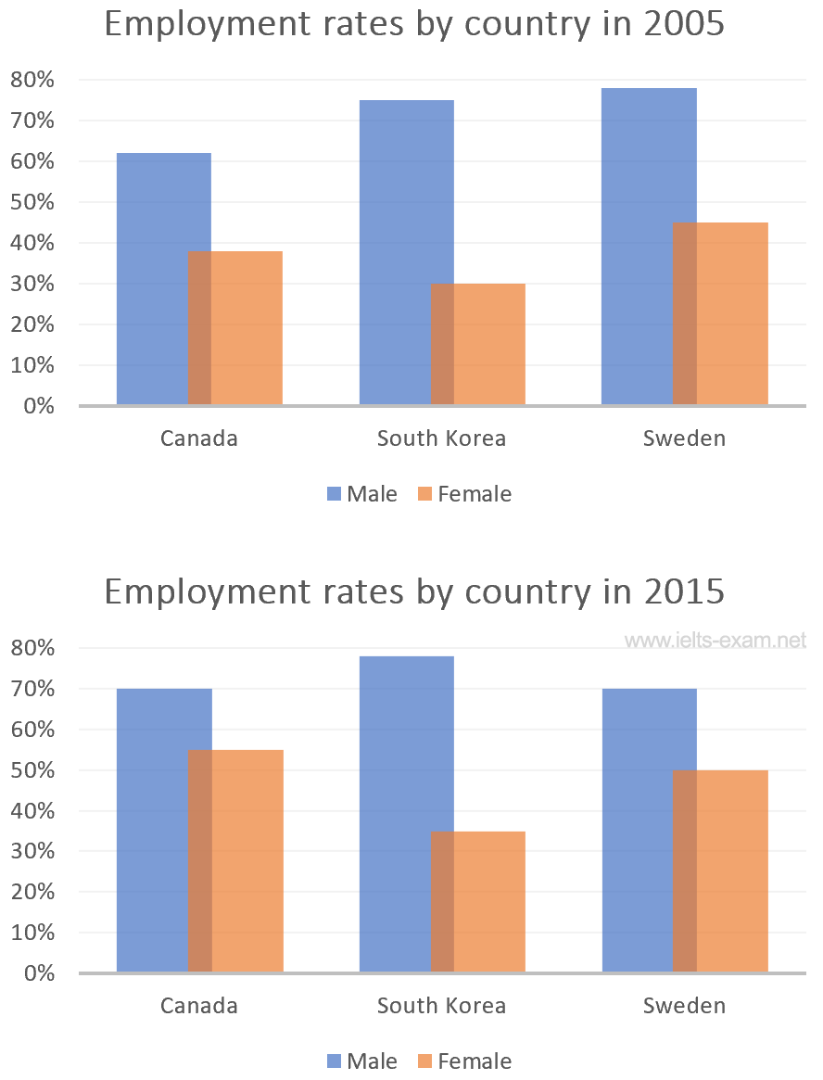
Top answer
The two bar charts give data (That is very vague. ) about how many ( How many would be numbers like 2,087,657. ) males and females engaged in employment (Unnatural) in three countries: Canada, South Korea, and Sweden in 2005 and 2015 .
- The two bar charts give data (That is very vague.
- ) about how many ( How many would be numbers like 2,087,657.
- ) males and females engaged in employment (Unnatural) in three countries: Canada, South Korea, and Sweden in 2005 and 2015 .
- ) Here is the best way to write the description.
- The two bar charts, dated 2005 and 2015, plot both male and female employment rates for three countries: Canada, Sweden and South Korea.
Get the Weekly English Kit 📬
New words, one handy idiom, and a 2-minute quiz — delivered to your inbox to keep your streak alive.
The two bar charts give data (That is very vague. What is plotted?) about how many (How many would be numbers like 2,087,657. There are no absolute numbers on the charts.) males and females engaged in employment (Unnatural) in
 Related Questions