
Pls review my Ielts writing task 1 essay
The Charts Below Give Information About Attendance At Entertainment Venues And Admission Prices To Those Venues In 2009.
The bar chart illustrates how many people attended at entertainment centers and the table shows the cost of entering those facilities in 2009.
Overall, cinemas had the highest number of entrance slots taken by the public while charged for the lowest price of fee. In addition, Football Game - AFL required the highest cost for entertainment.
The number of attendants went to entertainment spots was approximately 1050 thousands, which was three times as much the number of people joined the theme parks (around 350 thousands). Accounted for the lowest figure was sports centers, which was about 150 thousands people.
Football Game - AFL, Football Game - NRL, and Football Game - NRU dominated the prices for entrance fees, which was roughly 71 dollars worth for a single ticket and 280 dollars for a family ticket. 70 dollars for a ticket and 210 dollars for a 4-member family was expected to be paid to the Theme Parks. Significant differences in prices for entertainment was seen followed the price of Basketball Game’s, Bricket Game’s and Cinema’s fees of entry, with respective figures being 34, 24 and 15 dollars per person and 135, 80, 55 dollars per a family, compared to the prices of the four-most-expensive entertainment establishments above.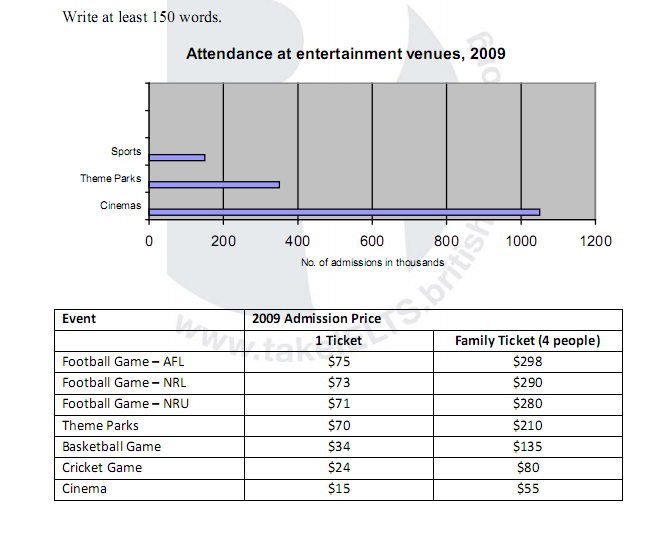
Top answer
The bar chart illustrates (wrong verb choice) how many people attended at entertainment centers (poor English) and the table shows the cost of entering (wrong verb) those facilities in 2009. Example opening paragraph The bar chart compares the [ total number of people who went to ] / [attendance at ] sports events, theme parks and cinemas in 2009. The accompanying table lists typical prices for single and 4-person (family) tickets.
- The bar chart illustrates (wrong verb choice) how many people attended at entertainment centers (poor English) and the table shows the cost of entering (wrong verb) those facilities in 2009.
- Example opening paragraph The bar chart compares the [ total number of people who went to ] / [attendance at ] sports events, theme parks and cinemas in 2009.
- The accompanying table lists typical prices for single and 4-person (family) tickets.
- It includes five different sporting events as well as one entry each for theme parks and cinemas.
- Note: "total number of people who went to " is a synonym for "attendance at".
Get the Weekly English Kit 📬
New words, one handy idiom, and a 2-minute quiz — delivered to your inbox to keep your streak alive.
The bar chart illustrates (wrong verb choice) how many people attended at entertainment centers (poor English) and the table shows the cost of entering (wrong verb) those facilities in 2009.
Example opening paragraph
Thanh BinhThe Charts Below Give Information About Attendance At Entertainment Venues And Admission Prices To Those Venues In 2009.
Those instructions are wrong. There are not two charts - there is one chart and a table.
I think you are not using a reputable website or resource for your practice tests.
 Related Questions