
PLS!!! Help me by checking my Writing task 1 _ Thanks
The charts below show the percentage of water used for different purposes in six areas of the world.
Summarise the information by selecting and reporting the main features and make comparisons where relevant.
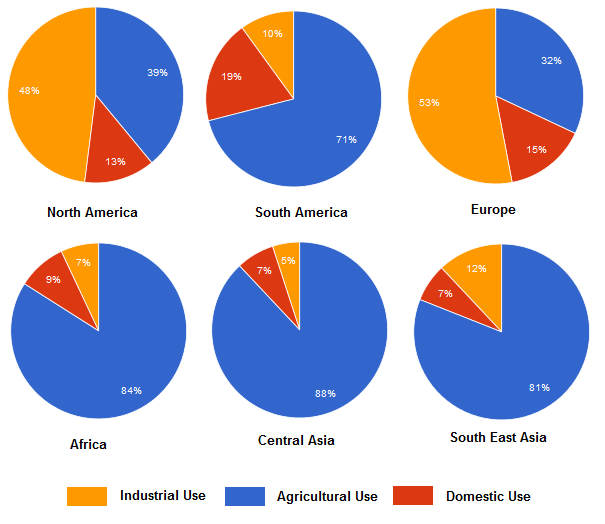
The charts illustrate the figure for water used for industry, agriculture and domestic purpose in North America, South America, Europe, Africa, Central Asia, and South East Asia.
Overall, most water in the other regions uses for agriculture, such as South America, Africa, Central Asia, and South East Asia. While North America and Europe have the largest segments of water used for industry.
Around 53% of water is spent on the industry in Europe. It is the largest segment of water used for industry in six areas. North America is the second area which has 48% water used for industry. In contrast, the figure for water used for agriculture in North America and Europe are the smallest segments, at 39% and 32% respectively.
In comparison, 71%, 81%, 84% ad 88% water is spent on agriculture in South America, South East Asia, Africa, and Central Asia respectively, while water consumption for the industry in four areas are lower than in North America and Europe. Water consumption for domestic purpose is small segments in three areas, namely North America, South East Asia, and Europe, with 13%, 7%, and 15% respectively.
Top answer
The (What kind of charts? ) charts illustrate (wrong word) the figure (wrong word) for water used for industry, agriculture and domestic purpose in North America, South America, Europe, Africa, Central Asia, and South East Asia. ) uses for agriculture, such as South America, Africa, Central Asia, and South East Asia.
- The (What kind of charts?
- ) charts illustrate (wrong word) the figure (wrong word) for water used for industry, agriculture and domestic purpose in North America, South America, Europe, Africa, Central Asia, and South East Asia.
- ) uses for agriculture, such as South America, Africa, Central Asia, and South East Asia.
- ) While North America and Europe have the largest segments (wrong word) of water used for industry.
- Around 53% of water is spent (wrong word.
Get the Weekly English Kit 📬
New words, one handy idiom, and a 2-minute quiz — delivered to your inbox to keep your streak alive.
The (What kind of charts? How many are there?) charts illustrate (wrong word) the figure (wrong word) for water used for industry, agriculture and domestic purpose in North America, South America, Europe, Africa, Central Asia, and South East Asia.
Overall,
 Related Questions